Measures of liquidity, Solvency, and Profitability The comparative financial statements of Marshall Inc. are as follows. The market price of Marshall common stock was $ 67 on December 31, 20Y2. Marshall Inc. Comparative Retained Earnings Statement For the Years Ended December 31, 20Y2 and 20Y1 20Υ2 20Y1 Retained earnings, January 1 $3,595,450 $3,035,750 Net income 851,200 621,800 Dividends: On preferred stock On common stock (10,500) (10,500) (51,600) (51,600) $4,384,550 Retained earnings, December 31 $3,595,450 Marshall Inc. Comparative Income Statement For the Years Ended December 31, 20Y2 and 20Y1 20Y2 20Υ1 Sales $4,847,930 $4,466,640 Cost of merchandise sold 1,594,320 1,466,770 Gross profit $3,253,610 $2,999,870 Selling expenses $1,112,980 $1,377,430 Administrative expenses 948,100 808,960 Total operating expenses $2,061,080 $2,186,390 Income from operations $1,192,530 $813,480 Other revenue and expense: Other revenue 62,770 51,920 Other expense (interest) (288,000) (158,400) Income before income tax expense $967,300 $707,000 Income tax expense 116,100 85,200 Net income $851,200 $621,800 Marshall Inc. Comparative Balance Sheet December 31, 20Y2 and 20Y1 20Υ2 20Υ1 Assets Current assets: Cash $726,520 $966,540 Marketable securities 1,099,590 1,601,690 Accounts receivable (net) 861,400 810,300 Inventories 642,400 496,400 Prepaid expenses 137,446 193,310 Total current assets $3.467.356 $4.068.240
Measures of liquidity, Solvency, and Profitability The comparative financial statements of Marshall Inc. are as follows. The market price of Marshall common stock was $ 67 on December 31, 20Y2. Marshall Inc. Comparative Retained Earnings Statement For the Years Ended December 31, 20Y2 and 20Y1 20Υ2 20Y1 Retained earnings, January 1 $3,595,450 $3,035,750 Net income 851,200 621,800 Dividends: On preferred stock On common stock (10,500) (10,500) (51,600) (51,600) $4,384,550 Retained earnings, December 31 $3,595,450 Marshall Inc. Comparative Income Statement For the Years Ended December 31, 20Y2 and 20Y1 20Y2 20Υ1 Sales $4,847,930 $4,466,640 Cost of merchandise sold 1,594,320 1,466,770 Gross profit $3,253,610 $2,999,870 Selling expenses $1,112,980 $1,377,430 Administrative expenses 948,100 808,960 Total operating expenses $2,061,080 $2,186,390 Income from operations $1,192,530 $813,480 Other revenue and expense: Other revenue 62,770 51,920 Other expense (interest) (288,000) (158,400) Income before income tax expense $967,300 $707,000 Income tax expense 116,100 85,200 Net income $851,200 $621,800 Marshall Inc. Comparative Balance Sheet December 31, 20Y2 and 20Y1 20Υ2 20Υ1 Assets Current assets: Cash $726,520 $966,540 Marketable securities 1,099,590 1,601,690 Accounts receivable (net) 861,400 810,300 Inventories 642,400 496,400 Prepaid expenses 137,446 193,310 Total current assets $3.467.356 $4.068.240

Financial Accounting
15th Edition
ISBN:9781337272124
Author:Carl Warren, James M. Reeve, Jonathan Duchac
Publisher:Carl Warren, James M. Reeve, Jonathan Duchac
Chapter17: Financial Statement Analysis
Section: Chapter Questions
Problem 4PA: Measures of liquidity, solvency, and profitability The comparative financial statements of Marshall...

Related questions
Question
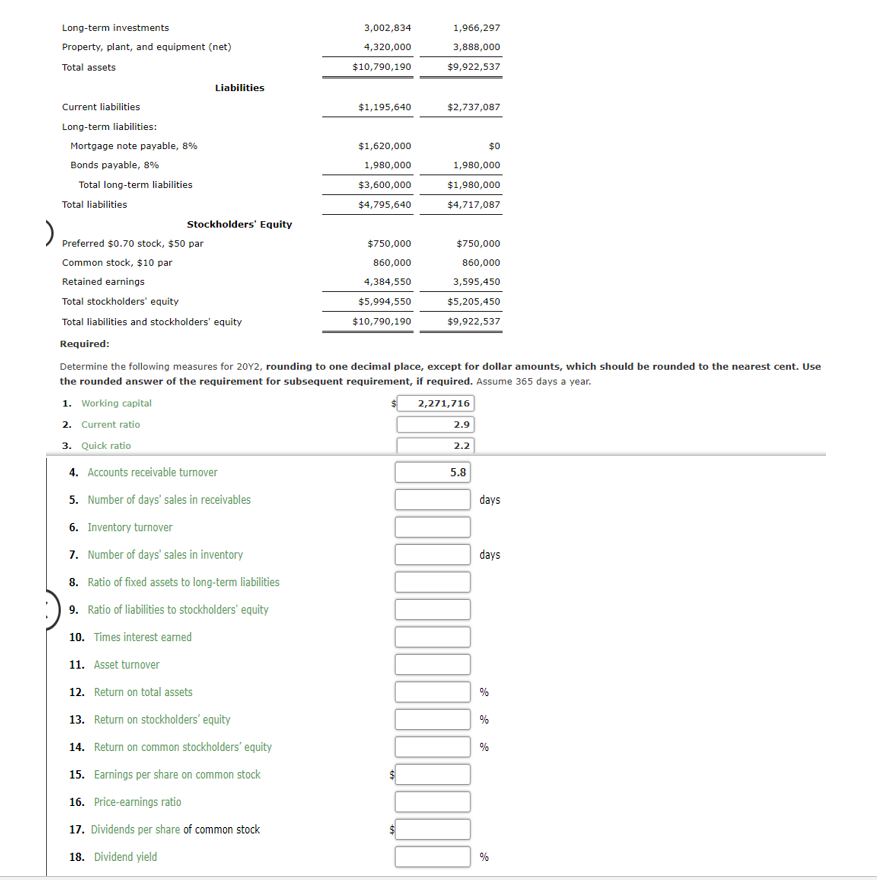
Transcribed Image Text:Long-term investments
3,002,834
1,966,297
Property, plant, and equipment (net)
4,320,000
3,888,000
Total assets
$10,790,190
$9,922,537
Liabilities
Current liabilities
$1,195,640
$2,737,087
Long-term liabilities:
Mortgage note payable, 8%
$1,620,000
$0
Bonds payable, 8%
1,980,000
1,980,000
Total long-term liabilities
$3,600,000
$1,980,000
Total liabilities
$4,795,640
$4,717,087
Stockholders' Equity
Preferred $0.70 stock, $50 par
$750,000
$750,000
Common stock, $10 par
860,000
860,000
Retained earnings
4,384,550
3,595,450
Total stockholders' equity
$5,994,550
$5,205,450
Total liabilities and stockholders' equity
$10,790,190
$9,922,537
Required:
Determine the following measures for 20Y2, rounding to one decimal place, except for dollar amounts, which should be rounded to the nearest cent. Use
the rounded answer of the requirement for subsequent requirement, if required. Assume 365 days a year.
1. Working capital
2,271,716
2. Current ratio
2.9
3. Quick ratio
2.2
4. Accounts receivable turnover
5.8
5. Number of days' sales in receivables
days
6. Inventory turnover
7. Number of days' sales in inventory
8. Ratio of fixed assets to long-term liabilities
days
9. Ratio of liabilities to stockholders" equity
10. Times interest earned
11. Asset turnover
12. Return on total assets
%
13. Return on stockholders' equity
14. Return on common stockholders“ equity
%
15. Earnings per share on common stock
16. Price-earnings ratio
17. Dividends per share of common stock
18. Dividend yield
%
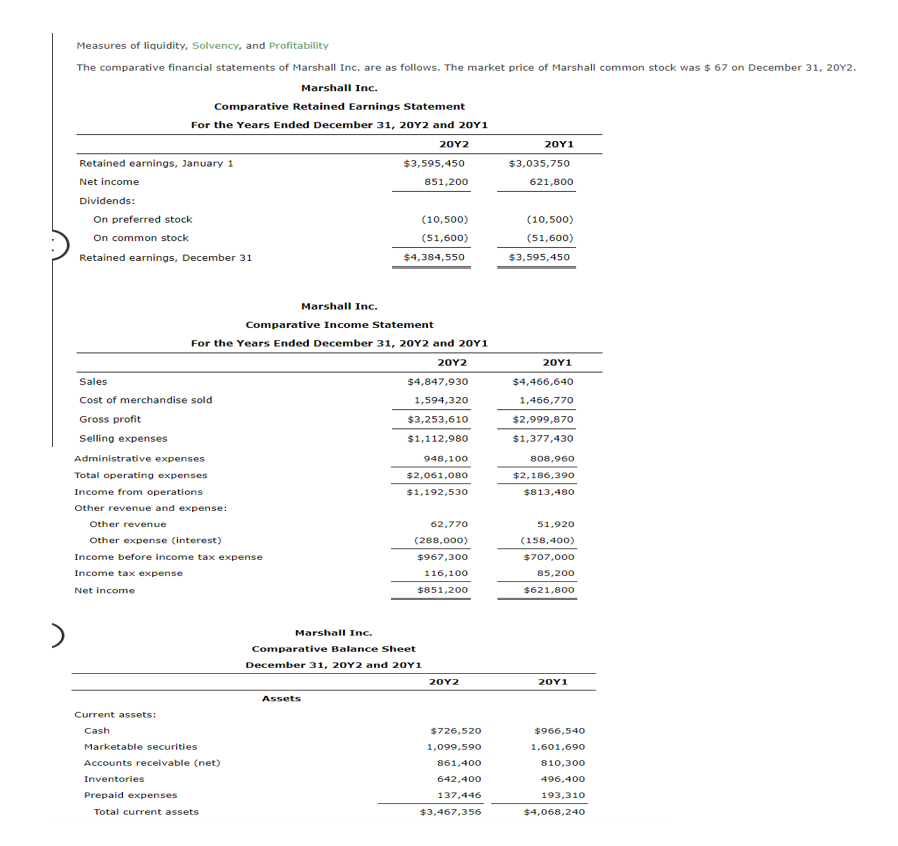
Transcribed Image Text:Measures of liquidity, Solvency, and Profitability
The comparative financial statements of Marshall Inc. are as follows. The market price of Marshall common stock was $ 67 on December 31, 20Y2.
Marshall Inc.
Comparative Retained Earnings Statement
For the Years Ended December 31, 20Y2 and 20Y1
20Y2
20Υ1
Retained earnings, January 1
$3,595,450
$3,035,750
Net income
851,200
621,800
Dividends:
On preferred stock
On common stock
(10,500)
(10,500)
(51,600)
(51,600)
Retained earnings, December 31
$4,384,550
$3,595,450
Marshall Inc.
Comparative Income Statement
For the Years Ended December 31, 20Y2 and 20Y1
20Υ2
20Υ1
Sales
$4,847,930
$4,466,640
Cost of merchandise sold
1,594,320
1,466,770
Gross profit
$3,253,610
$2,999,870
Selling expenses
$1,112,980
$1,377,430
Administrative expenses
948,100
808,960
Total operating expenses
$2,061,080
$2,186,39o
Income from operations
$1,192,530
$813,480
Other revenue and expense:
Other revenue
62,770
51,920
Other expense (interest)
(288,000)
(158,400)
Income before income tax expense
$967,300
$707,000
Income tax expense
116,100
85,200
Net income
$851,200
$621,800
Marshall Inc.
Comparative Balance Sheet
December 31, 20Y2 and 20Y1
20Y2
20Y1
Assets
Current assets:
Cash
$726,520
$966,540
Marketable securities
1,099,590
1,601,690
Accounts receivable (net)
861,400
810,300
Inventories
642,400
496,400
Prepaid expenses
137,446
193,310
Total current assets
$3,467,356
$4,068,24o
Expert Solution
This question has been solved!
Explore an expertly crafted, step-by-step solution for a thorough understanding of key concepts.

This is a popular solution!

Trending now
This is a popular solution!

Step by step
Solved in 2 steps

Knowledge Booster


Learn more about
Need a deep-dive on the concept behind this application? Look no further. Learn more about this topic, accounting and related others by exploring similar questions and additional content below.Recommended textbooks for you
Financial Accounting
Accounting
ISBN:
9781337272124
Author:
Carl Warren, James M. Reeve, Jonathan Duchac
Publisher:
Cengage Learning

Managerial Accounting
Accounting
ISBN:
9781337912020
Author:
Carl Warren, Ph.d. Cma William B. Tayler
Publisher:
South-Western College Pub

Financial And Managerial Accounting
Accounting
ISBN:
9781337902663
Author:
WARREN, Carl S.
Publisher:
Cengage Learning,
Financial Accounting
Accounting
ISBN:
9781337272124
Author:
Carl Warren, James M. Reeve, Jonathan Duchac
Publisher:
Cengage Learning
Managerial Accounting
Accounting
ISBN:
9781337912020
Author:
Carl Warren, Ph.d. Cma William B. Tayler
Publisher:
South-Western College Pub
Financial And Managerial Accounting
Accounting
ISBN:
9781337902663
Author:
WARREN, Carl S.
Publisher:
Cengage Learning,

Survey of Accounting (Accounting I)
Accounting
ISBN:
9781305961883
Author:
Carl Warren
Publisher:
Cengage Learning


Cornerstones of Financial Accounting
Accounting
ISBN:
9781337690881
Author:
Jay Rich, Jeff Jones
Publisher:
Cengage Learning