O B. The number of babies that were born C. The number of births per capita D. The weights of the babies at birth b. For samples of size 125, find the mean u; and standard deviation o, of all possible sample mean weights. H= (Type an integer or a decimal. Do not round.)

Glencoe Algebra 1, Student Edition, 9780079039897, 0079039898, 2018
18th Edition
ISBN:9780079039897
Author:Carter
Publisher:Carter
Chapter10: Statistics
Section10.4: Distributions Of Data
Problem 19PFA
icon
Related questions
icon
Concept explainers
Topic Video
Question
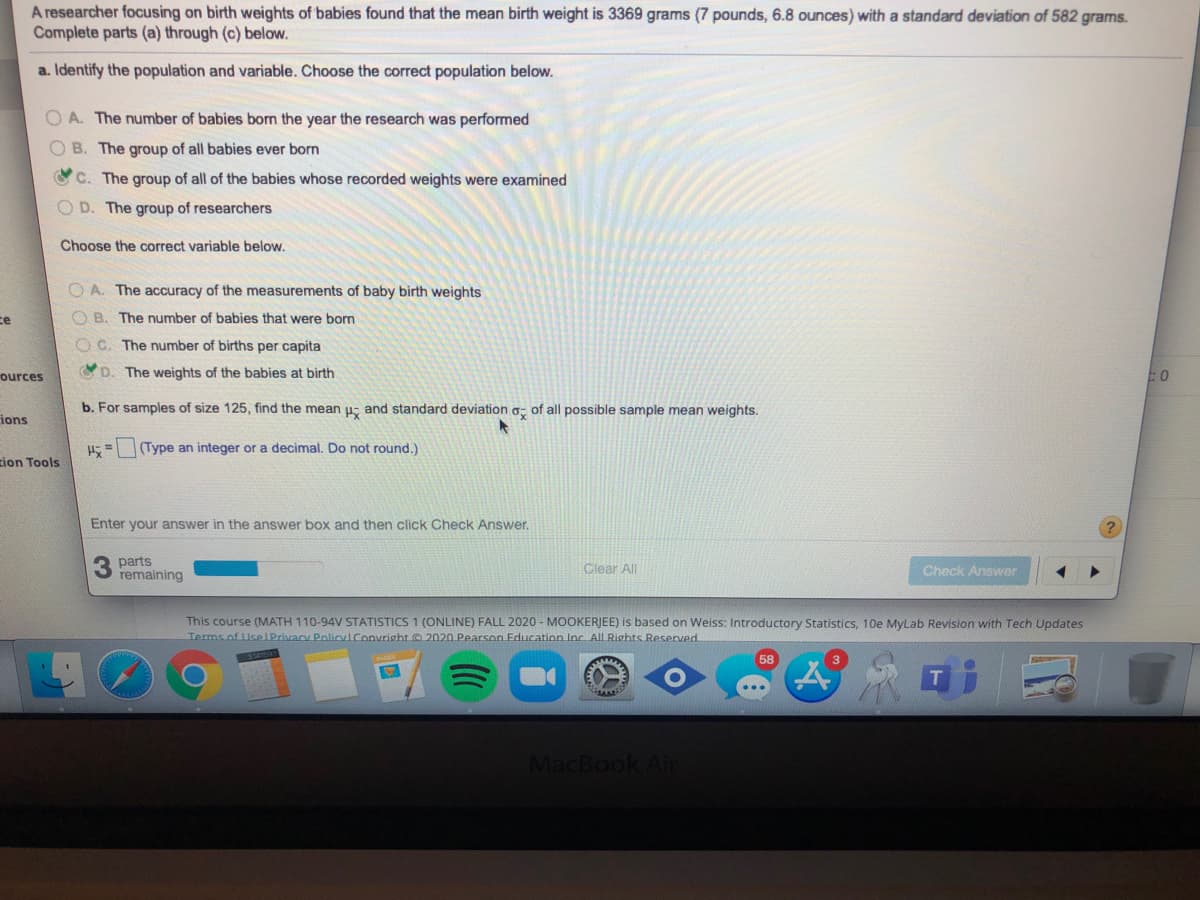
A researcher focusing on birth weights of babies found that the mean birth weight is 3369 grams (7 pounds, 6.8 ounces) with a standard deviation of 582 grams.
Complete parts (a) through (c) below.
a. Identify the population and variable. Choose the correct population below.
O A. The number of babies born the year the research was performed
B. The group of all babies ever born
O C. The group of all of the babies whose recorded weights were examined
D. The group of researchers
Choose the correct variable below.
O A. The accuracy of the measurements of baby birth weights
O B. The number of babies that were born
ce
O C. The number of births per capita
ources
D. The weights of the babies at birth
b. For samples of size 125, find the mean u, and standard deviation o, of all possible sample mean weights.
ions
(Type an integer or a decimal. Do not round.)
zion Tools
Enter your answer in the answer box and then click Check Answer.
parts
remaining
Clear All
Chack Answer
This course (MATH 110-94V STATISTICS 1 (ONLINE) FALL 2020 - MOOKERJEE) is based on Weiss: Introductory Statistics, 10e MyLab Revision with Tech Updates
Terms of UselPrivacy PolirvlConvright 2020 Pearson Education Inc All Rights Reserved.
58
MacBook Air
Transcribed Image Text:A researcher focusing on birth weights of babies found that the mean birth weight is 3369 grams (7 pounds, 6.8 ounces) with a standard deviation of 582 grams. Complete parts (a) through (c) below. a. Identify the population and variable. Choose the correct population below. O A. The number of babies born the year the research was performed B. The group of all babies ever born O C. The group of all of the babies whose recorded weights were examined D. The group of researchers Choose the correct variable below. O A. The accuracy of the measurements of baby birth weights O B. The number of babies that were born ce O C. The number of births per capita ources D. The weights of the babies at birth b. For samples of size 125, find the mean u, and standard deviation o, of all possible sample mean weights. ions (Type an integer or a decimal. Do not round.) zion Tools Enter your answer in the answer box and then click Check Answer. parts remaining Clear All Chack Answer This course (MATH 110-94V STATISTICS 1 (ONLINE) FALL 2020 - MOOKERJEE) is based on Weiss: Introductory Statistics, 10e MyLab Revision with Tech Updates Terms of UselPrivacy PolirvlConvright 2020 Pearson Education Inc All Rights Reserved. 58 MacBook Air
Expert Solution
steps

Step by step

Solved in 2 steps with 2 images

Blurred answer
Knowledge Booster
Centre, Spread, and Shape of a Distribution
Learn more about
Need a deep-dive on the concept behind this application? Look no further. Learn more about this topic, statistics and related others by exploring similar questions and additional content below.
Recommended textbooks for you
Glencoe Algebra 1, Student Edition, 9780079039897…
Algebra
ISBN:
9780079039897
Author:
Carter
Publisher:
McGraw Hill