O Construct a frequency distribution table to represent the summary information of the variable ehicle Class" and display the results in a pie chart.


Q: Here are the shopping times (in minutes) for a sample of 6 shoppers at a particular grocery store. 2...
A:
Q: 34% of likely U.S. voters think that the federal government should get more involved in fighting loc...
A: Given that; Probability (P) = 34% Sample size (n) = 6 By using binomial distribution Mean = n × ...
Q: Sara works for a hair salon and receives tips from her customers. The weekly tips(in AED) she receiv...
A:
Q: The population of a certain academic department is composed of 5,000 students from 1st year to 5th y...
A: Estimating the sample size (n) when Population is finite and known. The formula is developed by slov...
Q: Xand R charts are to be used to control a critical dimension on a certain product using a subgroup s...
A:
Q: 4. The label on a can of pineapple slices states that the mean carbohydrate content per serving of c...
A:
Q: According to a Survey, households in the city X spend an average of $24 per week on their leisure ac...
A: Given that μ = 24 , ?2 = 36 , n=100 Note: According to bartleby experts question answers guidelines...
Q: A manufacturing concern wants to estimate the average amount of purchase of its product in a month b...
A:
Q: Suppose that 3% of all adults suffer from diabetes and that 28% of all adults are obese. Suppose als...
A:
Q: A drug test correctly gives a positive result 94 percent of the time. However, 2 percent of the time...
A:
Q: 2. Suppose there are two normally distributed populations. One population has variance of 12, and wh...
A:
Q: (a) What is the probability that the selected individual owns shares in the balanced fund? (b) What ...
A: It is given that P(money market) = 0.21, P(Short bond) = 0.14, P(intermediate bond) = 0.05, P(long b...
Q: Calculate the confidence intervals for 100 mg/L cholesterol at 90% and 95% confidence levels. Suppos...
A: Given Information: x=100 mg/L Confidence levels = 90% and 95% and the z-values for various confidenc...
Q: 0. 6. Calculate regression equation from the following and take deviation from x = 7 and y = 5: x = ...
A:
Q: If the variable Z is normally distributed with mean equal to 0 and standard deviation equal to 1. T...
A: the variable Z is normally distributed with mean equal to 0 and standard deviation equal to 1.
Q: Table 2: Significant Relationship between Management Capability and Productivity of Employees Produc...
A: Definition: Interpretation of r-value: 0.90 to 1.00 – Very strong Positive (negative) correlation ...
Q: Consider a machine shop having 20 machines and that the chance of any one of them mal functioning du...
A:
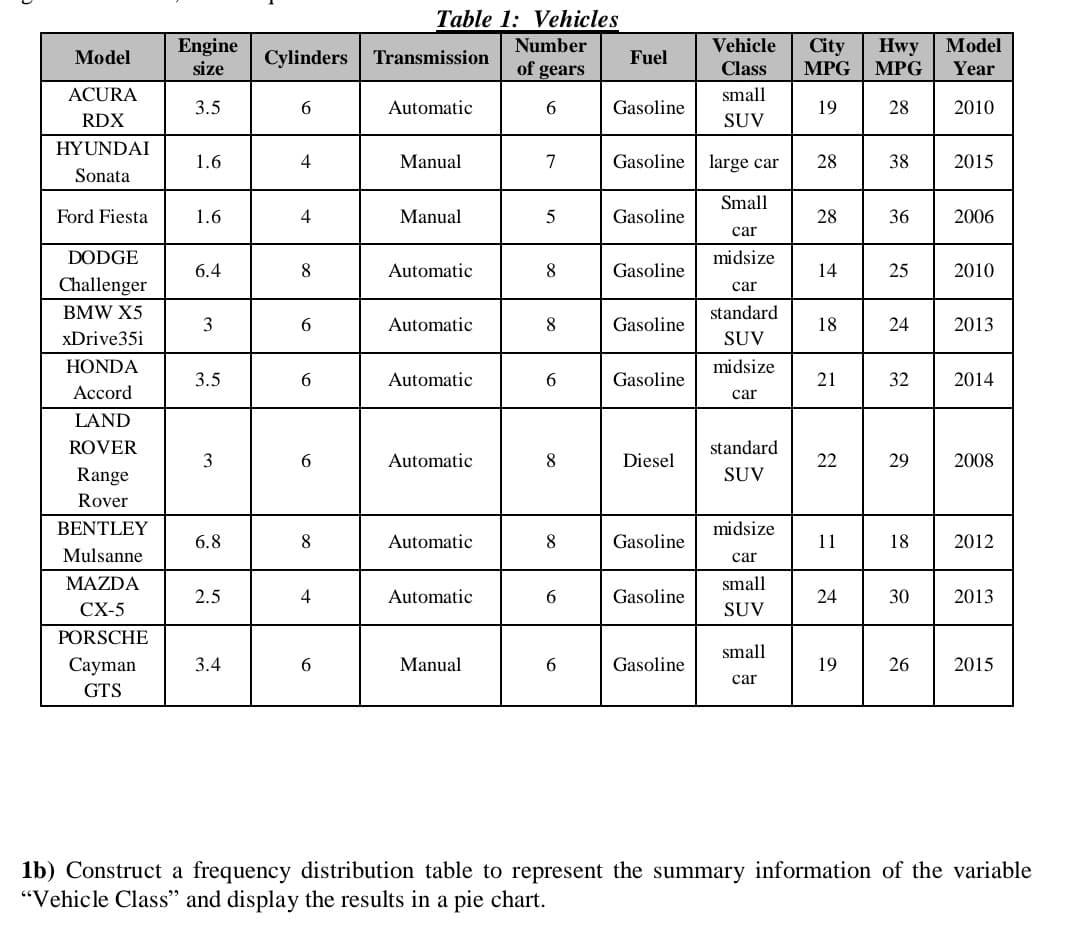
Q: Table 1: Vehicles Hwy MPG Model Engine size Number Vehicle Cylinders City MPG Model Transmission Fue...
A: As per our guidelines, we can answer only the first three sub-parts, Kindly repost the others for th...
Q: One way to take samples from the field is by using Quadrats. How is it done? Give a specific example...
A: Given information: It is required to give an example for Quadrats.
Q: Find the sample variance and standard deviation. 4, 47, 14, 48, 32, 22, 34, 28, 27, 32
A: Given,4, 47, 14, 48, 32, 22, 34, 28, 27, 32 sample size(n)=10sample mean(x¯)=4+47+14+48+32+22+34+2...
Q: Calculate co-efficient of concurrent deviation from the data given below: No. of employees : 250 300...
A:
Q: Xxample 10.5.7 In random samples of 600 and 1000 men from two cities, 400 and 600 men are respective...
A:
Q: Suppose that the average number of Facebook friends that users have is normally distributed with a m...
A:
Q: The mean yield of wheat from a district A was 210 tbs. with S.D.= 10 lbs. per acre from a sample of ...
A:
Q: A principal of a college wants to estimate the proportion of smokers among his students. What size o...
A:
Q: A population with u = 45 and o = 10 is standardized to create a new distribution withu= 100 and o = ...
A:
Q: If 240 users of Charinex-D are randomly selected, how many would we expect to experience insomnia as...
A: Let p be the proportion of patients in the study experienced insomnia as a side effect. Given that p...
Q: If e is the angle between the two regression lines of y on x and x on y. Then 1- 7? 2. X y prove tha...
A: For the provided lines with defined slopes of m1 and m2, the acute angle (defined as θ) is given as:...
Q: the variable Z is normally distributed with mean equal to 0 and standard deviation equal to 1. The ...
A: Given that Z is normally distributed with mean equal to 0 and standard deviation equal to 1.
Q: Exercise 01-1 11-90 |21-30o131-401나1-50151-60 161-구0 4 Class Lfrequenay 3 find the follaung) Omean O...
A: Note: According to Bartleby guidelines expert solve only one question and maximum 3 subpart of the f...
Q: The rank correlation coefficient of a debating contest involving 10 participants was calculated as 0...
A:
Q: Instruction: Covert the following in z scores and construct the normal curve 1. X = 80, X, = 85, u =...
A:
Q: QUESTION 7 Observation Income ($ x 1000) Education (Years) 1 30 12 2 28 12 3 52 18 16 16 4 40 35 The...
A: Given that X Rank(X) Y Rank(Y) 30 2 12 1.5 28 1 12 1.5 52 5 18 5 40 4 16 3.5 35 3 16 3...
Q: CASE: You want to determine the degree/strength of relationship between height and weight. Variable ...
A: Given, r=-0.65 So there is a moderate negative relationship between the two variables height (X)and ...
Q: For the following problem: 1) state your hypotheses 2) draw/paste a graph showing the critical z-sco...
A: Given that Hypothesized Population Mean (\mu)(μ) = 8585 Standard Deviation (\sigma)(S) = 2020...
Q: A project yields an average cash flow of 500 lakhs with a standard deviation of 60 lakhs. Calculate ...
A:
Q: Nutrition labels. The nutrition label on a bag of potato chips says that a serving of potato chips h...
A:
Q: Calculate Karl Pearson's coefficient of correlation from the following data using 20 as the working ...
A:
Q: Q1/For the below frequency distribution table calculate all the below reequipments. Class Frequency ...
A: Frequency of a class is the number of observations lie in that class. Mean of a grouped data using t...
Q: 5. The Warren truss shown below is composed of similar members all of which are 3 m long. Determine ...
A:
Q: If the variable Z is normally distributed with mean equal to 0 and standard deviation equal to 1. T...
A: The variable Z is normally distributed with mean equal to 0 and standard deviation equal to 1.
Q: A radio shop sells, on an verage, 200 radios per day with a standard deviation of 50 radios After an...
A: We have to develop the null hypothesis and alternative hypothesis, test at alpha=0.05 level of sig...
Q: In a robotic contest, all 30 finalists were given cash prizes. The winner was given RM3000 the secon...
A:
Q: The accompanying dataset provides the closing prices for four stocks and the stock exchange over 12 ...
A: Given information: The time series data is given.
Q: A principal of a college wants to estimate the proportion of smokers among his students Vhat size of...
A: Given: Population proportion (p) = 0.30 Margin of error (E) = 0.10 Assuming confidence level to be 9...
Q: derive the variance of standard normal distribution using the MGF; show complete solution.
A: Given: random variable x follow standard normal distribution then derive the variance of standard no...
Q: The average student loan debt for college graduates is $25,600. Suppose that that distribution is no...
A:
Q: You are given the following information relating to a frequency distribution comprising 10 observati...
A: We have given that We have to find the correlation coefficient between X and Y :
Q: A certain four-cylinder combination lock has 45 numbers on it. To open it, you turn to a number on t...
A: Given that a certain four-cylinder combination lock has 45 numbers on it. To open it, you turn to a ...
Q: Suppose we want to test the null hypothesis of no day effect: i. Write down the mathematical express...
A: Solution:

Step by step
Solved in 3 steps with 1 images

- Table 2 Department Mean SD CoefVar Min Q1 Median Q3 Max IQR Skewness Finance 6.052 3.874 64.01 1.630 3.393 4.585 7.500 22.860 4.107 2.00 HR 5.441 3.235 59.45 2.000 3.200 4.100 6.430 21.860 3.230 1.24 IT 5.880 3.887 66.10 0.530 3.250 4.630 6.8 24.980 3.550 2.18 Marketing 6.010 3.737 62.18 1.670 3.475 5.000 6.645 22.200 3.170 2.14 Training 6.095 3.719 61.02 1.500 3.330 5.000 7.640 20.000 4.310 2.00 CoefVar stands for coefficient of variation graph (1) The company has hired you to answer the following questions: Do you think that the salaries in the departments are skewed, justify your answer with proper measure from table (2).The following table presents prices, in thousands of dollars, of single-family homes for 20 of the largest metropolitan areas in the United States for the first quarter of 2012 and the first quarter of 2013. . Metro Area 2012 2013 Boston, MA 311.5 332.2 Chicago, IL 157.2 159.4 Cincinnati, OH 112.5 121.0 Cleveland, OH 84.9 101.0 Dallas, TX 148.2 160.4 Denver, CO 226.4 261.2 Houston, TX 152.1 163.7 Los Angeles, CA 122.1 155.1 Miami, FL 182.0 219.9 Minneapolis, MN 147.3 170.6 Metro Area 2012 2013 New York, NY 363.8 368.2 Philadelphia, PA 193.5 197.7 Phoenix, AZ 129.9 169.0 Portland, OR 208.6 246.5 Riverside, CA 174.3 216.7 St. Louis, MO 103.7 111.0 San Diego, CA 359.5 412.3 San Francisco, CA 448.0…U.S. Manufactured General Aviation Shipments, 2009–2015 Year Qtr 1 Qtr 2 Qtr 3 Qtr 4 Total 2009 332 407 380 470 1,589 2010 240 368 281 426 1,315 2011 263 295 270 465 1,293 2012 305 365 343 518 1,531 2013 332 406 352 507 1,597 2014 343 366 368 521 1,598 2015 285 354 363 536 1,538 Use MegaStat or Minitab to calculate estimated seasonal indexes and trend. (Round your answers to 3 decimal places.) Qtr1Index Qtr2Index Qtr3Index Qtr4Index
- The table below contains the total cost ($) for four tickets to a basketball game purchased on the secondary market, two beers, two soft drinks, two hot dogs, and one parking space at each arena during a recent season. 215.02 224.58 224.43 215.97 203.04 287.43 261.25 214.76 395.96 317.13 301.05 370.49 310.61 319.41 319.33 420.73 420.32 481.66 484.87 430.76 411.28 543.08 566.08 535.56 532.38 619.08 727.78 766.28 791.92 897.06 a. Organize these costs as an ordered array. b. Construct a frequency distribution and a percentage distribution for these costs. c. Around what values, if any, are at least 75% of the costs of attending the game concentrated? Explain. At least 75% of the costs of attending a game are concentrated around the class groupings "$200 but less than $400" and "$500 but less than $700." B. At least 75% of…The table below contains the total cost (in $) for four average-priced tickets, two beers, four soft drinks, four hot dogs, two game programs, two adult-sized caps, and one parking space for 30 basketball arenas. Complete parts (a) and (b) below. $202.66 $314.74 $208.84 $315.08 $213.26 $316.01 $220.01 $317.75 $239.09 $321.45 $244.25 $326.56 $252.44 $332.44 $258.15 $344.31 $269.28 $385.08 $278.86 $404.02 $296.35 $433.59 $303.07 $460.96 $305.79 $481.44 $310.53 $533.49 $312.01 $661.04The following data show Transportation Budget for North Carolina (Let year 1- 2003)Year = 2003 Budget (in millions) = 385Year = 2004 Budget (in millions) = 397Year = 2005 Budget (in millions) = 452Year = 2006 Budget (in millions) = 501Year = 2007 Budget (in millions) = 446Year = 2008 Budget (in millions) = 450Year = 2009 Budget (in millions) = 593Year = 2010 Budget (in millions) = 654Year = 2011 Budget (in millions) = 846Year = 2012 Budget (in millions) = 911Year = 2013 Budget (in millions) = 1483Year = 2014 Budget (in millions) = 1897a) Create a scatter plot and be sure to LABEL BOTH axis and give the chart an overall name. Have the graph display the “r-value” and the correct equation.b) What kind of correlation is this?c) Is this more of a linear or exponential model? Why?d) Predict the budget for 2020
- NORTH–SOUTH AIRLINE CASENorthern Airline DataAirframe CostEngine CostAverage AgeYearper Aircraftper Aircraft(Hours)200151.8043.496,512200254.9238.588,404200369.7051.4811,077200468.9058.7211,717200563.7245.4713,2752006 84.7350.2615,215200778.7479.6018,390Southeast Airline DataAirframe CostEngine CostAverage AgeYearPer Aircraftper Aircraft(Hours)200113.2918.865,107200225.1531.558,145200332.1840.437,360200431.7822.105,773200525.3419.697,150200632.7832.589,364200735.5638.078,2591. Develop Regression equations for each cost category as dependent variables and average age as independent variables. Do this for each Airline. Look at graphs produced by QM2. From the regression results, what would you conclude about a) airframe vs engine costs for each airlineb) comparing airlines as to airframe costsc) comparing airlines as to engine costsd) Provide a brief summary report of your comparisonsThe table below contains the total cost ($) for four tickets to a basketball game purchased on the secondary market, two beers, two soft drinks, two hot dogs, and one parking space at each arena during a recent season. 290.24 201.69 234.33 282.03 263.89 273.47 264.47 240.17 369.58 308.31 382.64 350.91 330.95 336.79 380.73 448.45 408.98 420.79 417.76 443.36 487.68 508.87 569.96 539.05 544.23 676.06 727.83 768.33 709.92 882.69 a. Organize these costs as an ordered array. b. Construct a frequency distribution and a percentage distribution for these costs. c. Around what values, if any, are at least 75% of the costs of attending the game concentrated? Explain.Rank Name Units Sales ($ millions) 1 Domino’s~~ 17583 13640 2 Pizza Hut~` 20363 13493 3 Little Caesars Pizza* 6038 5271 4 Papa John’s International* 5906 3868 5 Papa Murphy’s International* 1550 889 6 California Pizza Kitchen* 264 865 7 Marco’s Pizza 1030 698 8 Chuck E. Cheese’s/Peter Piper Pizza* 829 560 9 Sbarro* 693 533 10 Round Table Pizza* 500 515 11 CiCi’s Pizza** 507 485 12 Hungry Howie’s Pizza 606 445 13 MOD Pizza* 494 438 14 Jet’s Pizza 423 408 15 Blaze Pizza** 298 355 16 Old Chicago Pizza and Taproom~*^ 129 345 17 Godfather’s Pizza* 507 285 18 Pizza Ranch 228 281 19 Uno Chicago Grill** 133 265 20 Rosati’s Pizza 168 239 21 Mellow Mushroom* 214 231 22 Donatos Pizza 180 215 23 Villa Fresh Italian Kitchen** 255 190 24 Mountain Mike’s Pizza 227 187 25 LaRosa’s Pizzeria 65 179 26 Papa Gino’s Pizzeria* 89 170 27 Mr. Gatti’s Pizza* 130 166 28 Mazzio’s Italian Eatery* 163 145 29 Giordano’s Restaurant & Pizzeria* 70 142 30…
- Company Competitor 1383 1153 2022 1067 2429 1296 901 1406 2219 1254 1896 1335 1910 1204 1539 1076 2048 1246 2881 1098 2395 1258 1349 955 2052 954 2675 1363 1588 1022 2704 1155 3148 1807 2822 1295 2217 1116 2260 1323 3040 1326 3137 1107 2977 1163 2599 1254 2412 1017 3187 938 2598 1270 2995 1042 3046 1318 3858 1497 2438 750 3243 1380 2764 1053 2944 932 3324 1097 2797 1193 3914 1271 2766 843 2273 780 3052 1095 3202 1290 3672 937 3957 1390 3274 1056 3788 1235 3502 1235 2942 999 3078 1066 3196 641 3141 1322 3579 1289 3895 1060 above is the excel data, please solve the excel part with formulas and explanation, thanksU.S. Manufactured General Aviation Shipments, 2009–2015 Year Qtr 1 Qtr 2 Qtr 3 Qtr 4 Total 2009 310 408 390 477 1,585 2010 243 377 281 433 1,334 2011 268 289 286 480 1,323 2012 305 358 339 514 1,516 2013 329 413 353 520 1,615 2014 345 380 379 527 1,631 2015 296 374 378 544 1,592 Use MegaStat or Minitab to calculate estimated seasonal indexes and trend. Q1. Q2. Q3. Q4 In which quarters are shipments highest? Lowest?Akiko Hamaguchi, the manager at a small sushi restaurant in Phoenix, Arizona, is concerned that the weak economic environment has hampered foot traffic in her area, thus causing a dramatic decline in sales. Her cousin in San Francisco, Hiroshi Sato, owns a similar restaurant, but he has seemed to prosper during these rough economic times. Hiroshi agrees that higher unemployment rates have likely forced some customers to dine out less frequently, but he maintains an aggressive marketing campaign to thwart this apparent trend. For instance, he advertises in local papers with valuable two-for-one coupons and promotes early-bird specials over the airwaves. Despite the fact that advertising increases overall costs, he believes that this campaign has positively affected sales at his restaurant. In order to support his claim, Hiroshi provides his restaurant’s monthly sales (in $1,000s) and advertising costs (in $), as well as the monthly unemployment rate (in %) from San Francisco County. A…


