O z = 3.29 and z = -3.29 O z = 1.96 and z - -1.96 O z = 2.58 and z = -2.58 Suppose that the calculated z statistic for a particular hypothesis test is 1.92 and the alpha is 0.01. This z statistic is the critical region. Therefore, the researcher reject the null hypothesis, and he conclude the alternative hypothesis is probably correct.
O z = 3.29 and z = -3.29 O z = 1.96 and z - -1.96 O z = 2.58 and z = -2.58 Suppose that the calculated z statistic for a particular hypothesis test is 1.92 and the alpha is 0.01. This z statistic is the critical region. Therefore, the researcher reject the null hypothesis, and he conclude the alternative hypothesis is probably correct.

Glencoe Algebra 1, Student Edition, 9780079039897, 0079039898, 2018
18th Edition
ISBN:9780079039897
Author:Carter
Publisher:Carter
Chapter10: Statistics
Section10.3: Measures Of Spread
Problem 26PFA

Related questions
Question
Please do SubSets
Transcribed Image Text:Do: Graded Chapter 8 Problem Set
Standard Deviation = 1.0
.5000
.2500
.2500
-3
-2
-1
2
3
4
-0.67
0.67
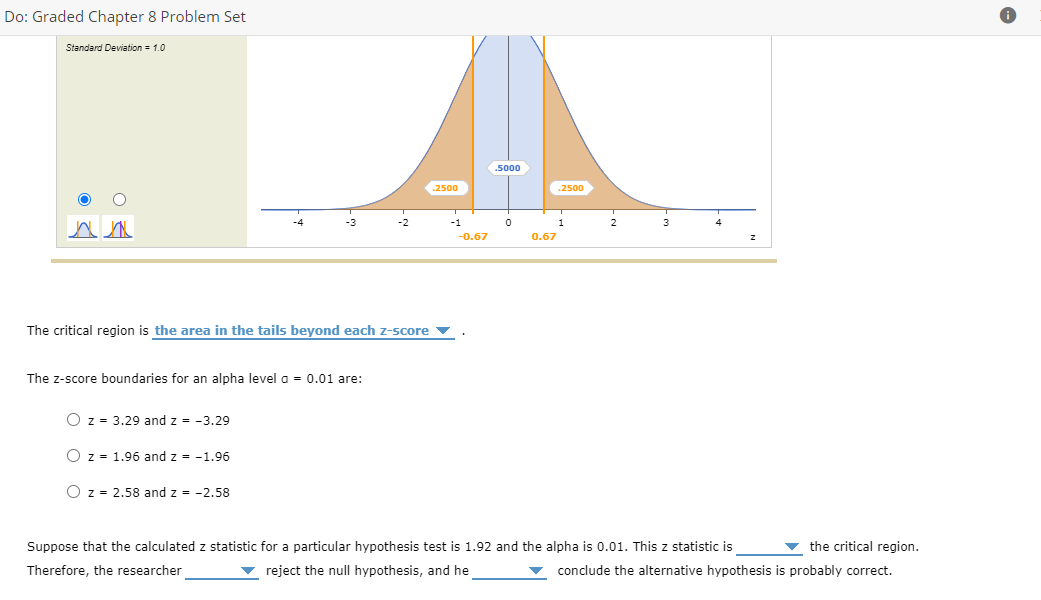
The critical region is the area in the tails beyond each z-score v
The z-score boundaries for an alpha level a = 0.01 are:
O z = 3.29 and z = -3.29
O z = 1.96 and z = -1.96
O z = 2.58 and z = -2.58
Suppose that the calculated z statistic for a particular hypothesis test is 1.92 and the alpha is 0.01. This z statistic is
v the critical region.
Therefore, the researcher
v reject the null hypothesis, and he
conclude the alternative hypothesis is probably correct.
Transcribed Image Text:Do: Graded Chapter 8 Problem Set
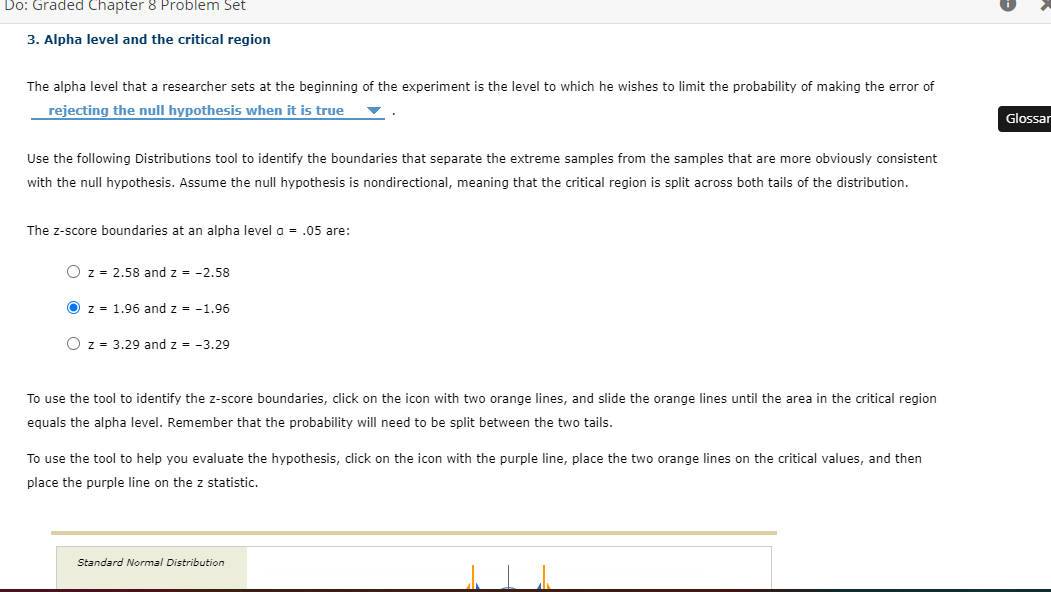
3. Alpha level and the critical region
The alpha level that a researcher sets at the beginning of the experiment is the level to which he wishes to limit the probability of making the error of
rejecting the null hypothesis when it is true
Glossar
Use the following Distributions tool to identify the boundaries that separate the extreme samples from the samples that are more obviously consistent
with the null hypothesis. Assume the null hypothesis is nondirectional, meaning that the critical region is split across both tails of the distribution.
The z-score boundaries at an alpha level a = .05 are:
O z = 2.58 and z = -2.58
O z = 1.96 and z = -1.96
O z = 3.29 and z = -3.29
To use the tool to identify the z-score boundaries, click on the icon with two orange lines, and slide the orange lines until the area in the critical region
equals the alpha level. Remember that the probability will need to be split between the two tails.
To use the tool to help you evaluate the hypothesis, click on the icon with the purple line, place the two orange lines on the critical values, and then
place the purple line on the z statistic.
Standard Normal Distribution
Expert Solution
This question has been solved!
Explore an expertly crafted, step-by-step solution for a thorough understanding of key concepts.

This is a popular solution!

Trending now
This is a popular solution!

Step by step
Solved in 2 steps

Recommended textbooks for you
Glencoe Algebra 1, Student Edition, 9780079039897…
Algebra
ISBN:
9780079039897
Author:
Carter
Publisher:
McGraw Hill
Glencoe Algebra 1, Student Edition, 9780079039897…
Algebra
ISBN:
9780079039897
Author:
Carter
Publisher:
McGraw Hill