observed in the reservoir over the course of an hour while technicians needed. time (min) 0 10 30 chlorine concentration (mg/L) 0 0.15 0.10 0. (a) Plot the data provided in the above table on the axes below. Use th time and the vertical axis to represent chlorine concentration. Ass used to model the concentration in between each pair of observed communicate your graph clearly.
observed in the reservoir over the course of an hour while technicians needed. time (min) 0 10 30 chlorine concentration (mg/L) 0 0.15 0.10 0. (a) Plot the data provided in the above table on the axes below. Use th time and the vertical axis to represent chlorine concentration. Ass used to model the concentration in between each pair of observed communicate your graph clearly.

Algebra & Trigonometry with Analytic Geometry
13th Edition
ISBN:9781133382119
Author:Swokowski
Publisher:Swokowski
Chapter7: Analytic Trigonometry
Section7.6: The Inverse Trigonometric Functions
Problem 94E

Related questions
Question
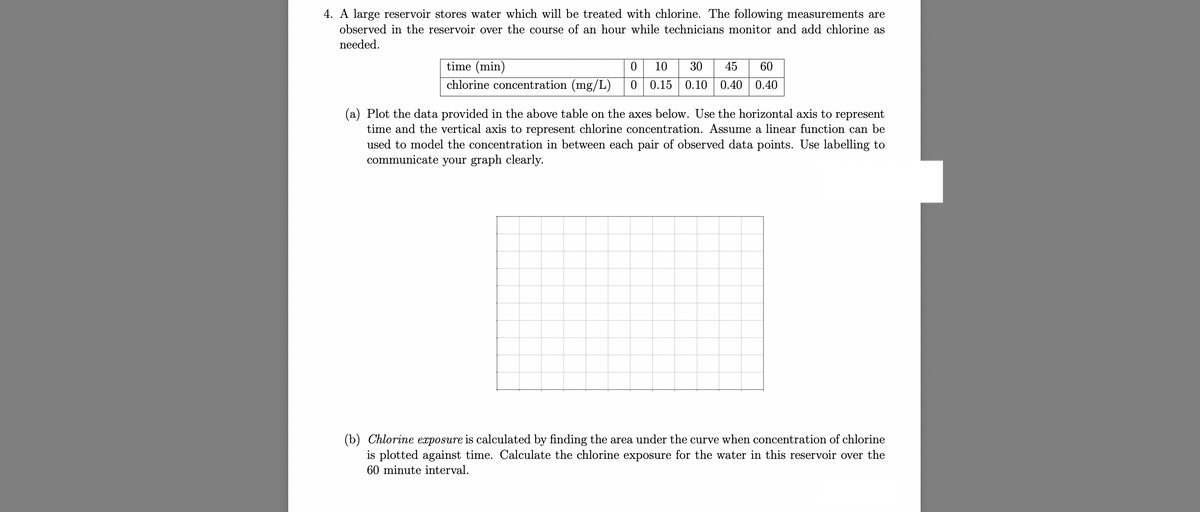
Transcribed Image Text:4. A large reservoir stores water which will be treated with chlorine. The following measurements are
observed in the reservoir over the course of an hour while technicians monitor and add chlorine as
needed.
time (min)
chlorine concentration (mg/L)
0 10 30 45 60
0.15 0.10 0.40 0.40
(a) Plot the data provided in the above table on the axes below. Use the horizontal axis to represent
time and the vertical axis to represent chlorine concentration. Assume a linear function can be
used to model the concentration in between each pair of observed data points. Use labelling to
communicate your graph clearly.
(b) Chlorine exposure is calculated by finding the area under the curve when concentration of chlorine
is plotted against time. Calculate the chlorine exposure for the water in this reservoir over the
60 minute interval.
Expert Solution
This question has been solved!
Explore an expertly crafted, step-by-step solution for a thorough understanding of key concepts.

Step by step
Solved in 3 steps with 3 images

Recommended textbooks for you
Algebra & Trigonometry with Analytic Geometry
Algebra
ISBN:
9781133382119
Author:
Swokowski
Publisher:
Cengage

Functions and Change: A Modeling Approach to Coll…
Algebra
ISBN:
9781337111348
Author:
Bruce Crauder, Benny Evans, Alan Noell
Publisher:
Cengage Learning

Algebra and Trigonometry (MindTap Course List)
Algebra
ISBN:
9781305071742
Author:
James Stewart, Lothar Redlin, Saleem Watson
Publisher:
Cengage Learning
Algebra & Trigonometry with Analytic Geometry
Algebra
ISBN:
9781133382119
Author:
Swokowski
Publisher:
Cengage
Functions and Change: A Modeling Approach to Coll…
Algebra
ISBN:
9781337111348
Author:
Bruce Crauder, Benny Evans, Alan Noell
Publisher:
Cengage Learning
Algebra and Trigonometry (MindTap Course List)
Algebra
ISBN:
9781305071742
Author:
James Stewart, Lothar Redlin, Saleem Watson
Publisher:
Cengage Learning