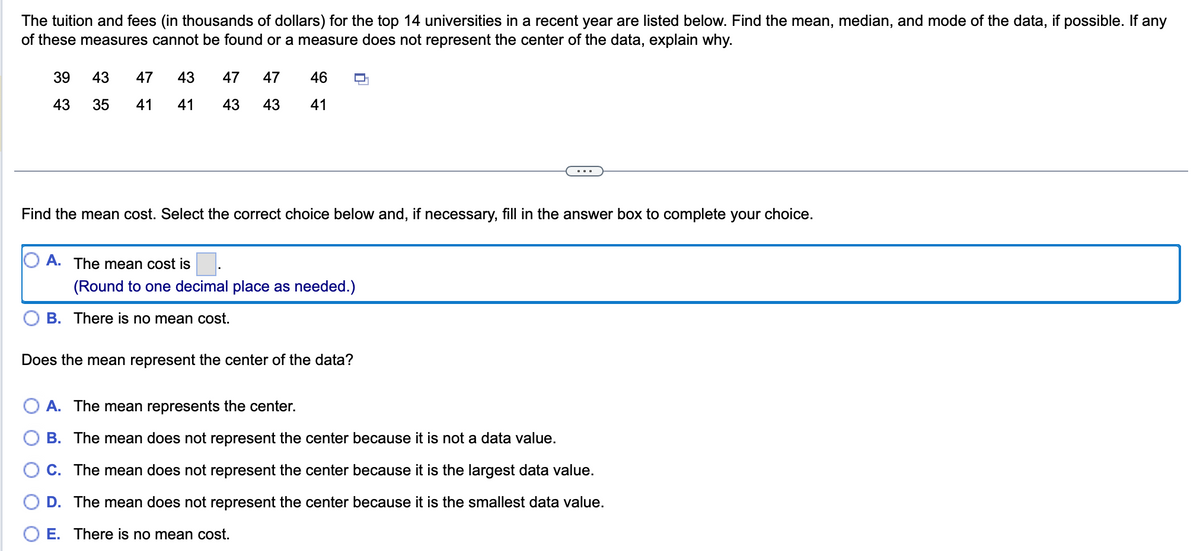
of these measures cannot be found or a measure does not represent the center of the data, 39 43 47 43 47 47 46 43 35 41 41 43 43 41 Find the mean cost. Select the correct choice below and, if necessary, fill in the answer box OA. The mean cost is (Round to one decimal place as needed.) OB. There is no mean cost. Does the mean represent the center of the data? ... OA. The mean represents the center. OB. The mean does not represent the center because it is not a data value.
of these measures cannot be found or a measure does not represent the center of the data, 39 43 47 43 47 47 46 43 35 41 41 43 43 41 Find the mean cost. Select the correct choice below and, if necessary, fill in the answer box OA. The mean cost is (Round to one decimal place as needed.) OB. There is no mean cost. Does the mean represent the center of the data? ... OA. The mean represents the center. OB. The mean does not represent the center because it is not a data value.
Glencoe Algebra 1, Student Edition, 9780079039897, 0079039898, 2018
18th Edition
ISBN:9780079039897
Author:Carter
Publisher:Carter
Chapter10: Statistics
Section10.4: Distributions Of Data
Problem 19PFA
Related questions
Question

Transcribed Image Text:The tuition and fees (in thousands of dollars) for the top 14 universities in a recent year are listed below. Find the mean, median, and mode of the data, if possible. If any
of these measures cannot be found or a measure does not represent the center of the data, explain why.
39
43
43
35
47 43
41 41
47 47 46
43
43
41
Find the mean cost. Select the correct choice below and, if necessary, fill in the answer box to complete your choice.
A. The mean cost is.
(Round to one decimal place as needed.)
B. There is no mean cost.
Does the mean represent the center of the data?
A. The mean represents the center.
B. The mean does not represent the center because it is not a data value.
C. The mean does not represent the center because it is the largest data value.
D. The mean does not represent the center because it is the smallest data value.
O E. There is no mean cost.

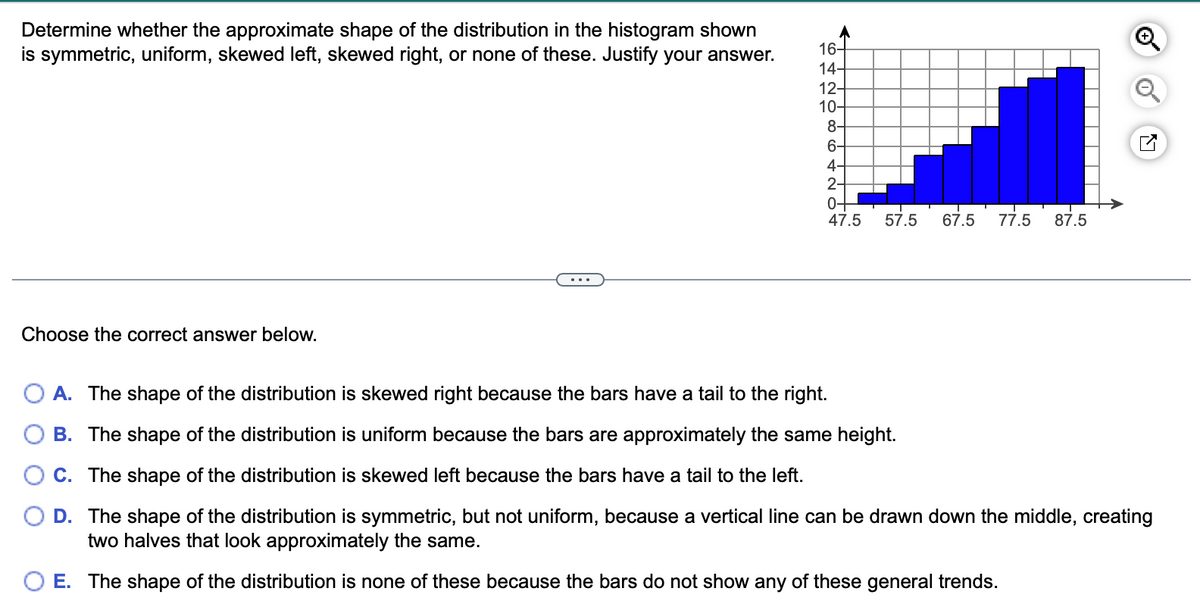
Transcribed Image Text:Determine whether the approximate shape of the distribution in the histogram shown
is symmetric, uniform, skewed left, skewed right, or none of these. Justify your answer.
Choose the correct answer below.
16+
14-
12-
10-
8-
6-
4-
2-
0-
47.5
57.5 67.5 77.5 87.5
Q
A. The shape of the distribution is skewed right because the bars have a tail to the right.
B. The shape of the distribution is uniform because the bars are approximately the same height.
C. The shape of the distribution is skewed left because the bars have a tail to the left.
D. The shape of the distribution is symmetric, but not uniform, because a vertical line can be drawn down the middle, creating
two halves that look approximately the same.
O E. The shape of the distribution is none of these because the bars do not show any of these general trends.
Expert Solution
This question has been solved!
Explore an expertly crafted, step-by-step solution for a thorough understanding of key concepts.
Step by step
Solved in 3 steps

Recommended textbooks for you

Glencoe Algebra 1, Student Edition, 9780079039897…
Algebra
ISBN:
9780079039897
Author:
Carter
Publisher:
McGraw Hill

Big Ideas Math A Bridge To Success Algebra 1: Stu…
Algebra
ISBN:
9781680331141
Author:
HOUGHTON MIFFLIN HARCOURT
Publisher:
Houghton Mifflin Harcourt

Glencoe Algebra 1, Student Edition, 9780079039897…
Algebra
ISBN:
9780079039897
Author:
Carter
Publisher:
McGraw Hill

Big Ideas Math A Bridge To Success Algebra 1: Stu…
Algebra
ISBN:
9781680331141
Author:
HOUGHTON MIFFLIN HARCOURT
Publisher:
Houghton Mifflin Harcourt