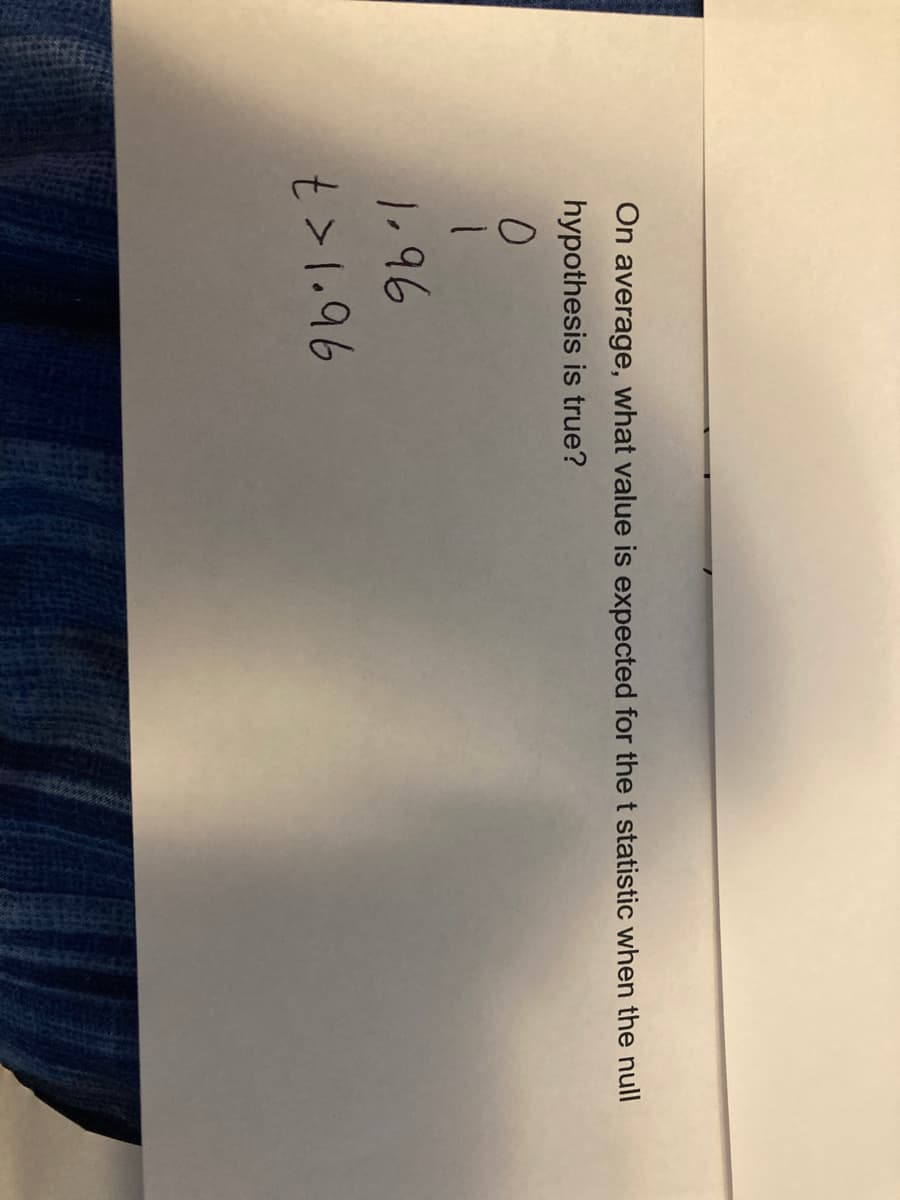
On average, what value is expected for the t statistic when the null hypothesis is true? 0 1 1.96 t>1.96


Q: (b) recheck Point estimate: 7,241 Sample standard deviation: 1,436 critical value: 1,833 Calculate…
A: Given, sample size, n = 10Sample mean, = 7.241Sample standard deviation, s = 1.436Population mean,…
Q: Using SPSS explain 1 example per group of quantitative research. Analyze your result using Chart
A: In this task, you are requested to demonstrate the application of SPSS in analyzing quantitative…
Q: A sleep disorder specialist wants to test the effectiveness of a new drug that is reported to…
A: The given data is as follows:Patient Hours of sleep without the drugHours of sleep with the new…
Q: a. b. Show that the regression R2 in the regression of Y on X is the squared value of the sample…
A: R2=rXY2Yi=β0+β1⋅Xi+ui
Q: The average diameter of sand dollars on a certain island is 5.00 centimeters with a standard…
A: From the provided information,
Q: CONSIDER THE FOLLOWING Group A researchers tested Ho P1 P2 versus Ha: P1 P2 with a test statistic of…
A: Given ,Z = -2.015And Level of significance,,Null and alternative hypothesis for Group ANull and…
Q: The data below are from an independent-measures experiment comparing three different treatment…
A: Group 1Group 2Group 313841510991221114617163
Q: The number of hits to a website follows a Poisson process. Hits occur at the rate of 13.5 per minute…
A: Let X be the number of hits in 13.5 per minute.So the mean number of hits in 1 minute (10:29 PM and…
Q: (to) What are the null hypothesesh and the alternative hypothesish What should be used to perform…
A: Let be the mean monthly mileage of cars rented in the US.Given that,Population mean Sample mean…
Q: A survey of 117 animals at a local animal shelter produced data as follows: Type of Pet…
A: It is given as the survey data in the tabulated form.The total number of animals = 117
Q: We are curious to see if college students get less sleep than the average person. It is known from…
A: From the provided information,Sample size (n) = 100Population standard deviation (σ) = 1Sample mean…
Q: Researchers are interested in determining if there is a difference in the proportion of women who…
A: The given information is:Nature of diagnosisNo. of patientsmastectomy190lumpectomy &…
Q: The mean score earned on the math SAT is522. The standard deviation of these scores is32. A special…
A: Sample size n =50Sample mean=533Population standard deviation =32NOTE:- According to bartleby…
Q: On an eight-question true-false quiz, a student guesses each answer. What is the probability that…
A: No. of question(n)=8The probability of guessing correct answer(p)==0.5Let "x" be that student…
Q: You have taken a random sample of sizen & 95of a normal population that has a population mean ofu =…
A: Sample size Sample mean Population standard deviation
Q: c)The confidence interval of the 95% Which built contradicts the ad claim? Choose the best answer…
A: Given population proportion, p = 42% = 0.42Sample size, n = 48Confidence level, C = 95% = 0.95Sample…
Q: The contingency table below summarizes a survey of 1,000 bottled beverage consumers. Recycles…
A: From the provided information,Lives in a state with a deposit lawLives in a state with no deposit…
Q: Part: 0 / 2 Part 1 of 2 Skip Part 73.6 69.3 64.5 65.4 Check Answer 76.5 71.4 68.5 66.0 Compute a…
A: It is given that The regression equation of line is y^ = 21.8495 + 0.6994x
Q: Sarah believes that completely cutting caffeine out of a person's diet will allow him or her more…
A: Supppose during each period, the participants record the number of nights of restful sleep that they…
Q: A researcher wants to study the relationship between salary and gender. She randomly selects 218…
A: The null and alternative hypotheses are:
Q: There is a 30% chance Ju Ren wears a purple shirt on any given day, and a 60% chance that she wear…
A: P(Purple shirt)=P(A)=30%=0.30P(wearing jeans)=P(B)=60%=0.60.
Q: Steve believes that his wife's cell phone battery does not last as long as his cell phone battery.…
A:
Q: Given two independent random samples with the following results: n₁ = 16 n₂ = 8 x₁ = 94 x₂ = 124 S₁…
A: From the given information, it can be assumed as followsThe population variances are equalThe two…
Q: Out of 400 applicants for a job, 217 are female and 60 are female and have a graduate degree. Step 1…
A: We have to find the probability that a randomly chosen applicant has a graduate degree, given that…
Q: Find the best point estimate for the ratio of the population variances given the following sample…
A: n1 = 25n2 = 13s12 = 110.299s22 = 77.132
Q: Ho: P₁ P2 Ha: Pi>P2 u obtain 174 successes in a sample of size ₁== 483 from the first population.…
A: Introduction:Denote >p1, p2 as the true population proportions of population 1 and population 2,…
Q: coefficients when the returns of the size-institutional ownership portfolio (columns 1 and 2)…
A: The main finding of this Table The table is the record of the The interpretation is that if the…
Q: 35. A researcher is interested in whether teenagers have changed how much they watch TV nowadays.…
A: According to the information provided in question,Hypothesised mean Population standard deviation…
Q: Please help it's not graded
A: The question is about categorical data analysis.Given :To find :Appropriate mechanics for the test.
Q: Based on your answer to part (a), which of the following statements is true?
A: Let be the population mean.Given that,Population mean Assume the level of significance Test…
Q: 13. When selecting a chart, it's important to choose the right type of chart to represent your data.…
A: “Since you have asked multiple questions, we will solve the first question for you. If you want any…
Q: A professor is concerned that the two sections of college algebra that he teaches are not performing…
A: For Sample 1 = 75.1s1 = 5.8n1 = 13For Sample 2 = 82.6s2 = 7.3n2 = 16Significance level, α= 0.02
Q: Construct a scatterplot with reading proficiency on the horizontal axis and math proficiency on the…
A: Here the dependent variable (y) is math proficiency and the independent variable (x) is reading…
Q: Refer to the table summarizing service times (seconds) of dinners at a fast food restaurant. How…
A: Time(sec)Frequency60-1198120-17922180-23916240-2993300-3596
Q: Single Factor SUMMARY Groups Treatment 1 Treatment 2 Treatment 3 Treatment 4 Count 16 19 17 15 Sum…
A: Answer Given n1 =16n2 =19n3 =17n4 =15
Q: When computing a t-test, it is important to distinguish between directional and nondirectional…
A: The question is about hypothesis testing.Introduction :1 ) If the claim / research statement…
Q: You wish to test the following claim (Ha) at a significance level of a = 0.002. Ho: P₁ P2 Ha: P1 P2…
A: The null and alternative hypothesis isH0:p1=p2Ha:p1p2sample proportion()=0.883sample…
Q: thanku Harper took out a $27,000 loan to pay for her home renovation. She will not make a payment…
A: To calculate the amount owed in 4 years with monthly compounding, we need to use the formula for…
Q: Claim more than 25% of a class is majoring in Nursing (or Nursing-BSN). Test at the 0.5 significance…
A: Student nameCourseSAMNursingKirazNursingEllieNursingStevenEngineering technologyAna(Y.M.B)Marketing…
Q: u and your friend have recently taken two different standardized mathematics exams. You scored 92 on…
A: The mean = 100The standard deviation = 10
Q: A large city is considering a voter referendum on a plastic bag ban. They plan on surveying…
A: A significant city may hold a plastic bag prohibition referendum. They will survey residents to…
Q: The electric company owns 40 generators which power the local area. Each of these generators has a…
A: From the provided information,n = 40Each of these generators has a 10% chance of needing maintenance…
Q: Under what circumstances can a very small treatment effect be statistically significant? Question 23…
A: It is given as the statement about to a very small treatment effect be statistically significant.
Q: What percentage of scores above-1 standard deviation? O 16% O 34% O 50% O 84%
A: It is given that the z-score is -1.
Q: QUESTIONS A) How many of the confidence intervals of 80% calculated from the twenty samples contain…
A: (A). Given Confidence coefficient = 0.80 and sample size n=20, therefore 20x0.8 = 16 confidence…
Q: which of the following statistics are meaningful in a data set that contains a large outlier?…
A: Since you have asked multiple questions, we will solve the first question for you. If you want any…
Q: A school principal claims that the number of students who are tardy to school does not vary from…
A: Given data:MonthNumberAug18Sept.13Oct.19Nov.14Dec.8Jan.6Feb.13Mar.11Apr.15May16In order to test the…
Q: 16. A pharmaceutical company is interested in a new medication which they believe will help lower…
A: A pharmaceutical company wants to develop a cholesterol-lowering drug. They assess cholesterol in 50…
Q: A company that makes batteries for electric cars indicates that its newest model of battery has an…
A: The question is about hypothesis testing.Given :Population mean life of a newest model of battery (…
Q: MidHinge Yes = Is the MidHinge resistant to outliers? No (Lower Quartile + Upper Quarti 2
A: It is given asMidHinge = ( Lower quartile + Upper quartile )/2

Step by step
Solved in 3 steps with 2 images

- Find the curve of best-fit y = axb to the following data by using the method of least square.Henry performed a two-tailed test for an experiment in which N = 24. He could not find his table of t critical values, but he remembered the tcv at df= 13. He decided to compare his tobt with this tcv. Is he more likely to make a Type I or a Type II error in this situation?If the value of Cronbach’s alpha is 0.07, it means ___________; a. Research instrument is not reliable b. Research instrument is internally consistent c. Data is reliable d. Data is internally consistent
- Test the null hypothesis that the slope is zero versus the two-sided alternative in the following setting using the alpha=0.05 signifiance level. n=20, yhat=28.5+1.4x, and SEb1=0.65a hypothesis test produces a t statistic of t=2.3. if the researcher is using a two tailed test with a=0.05 how large does the sample have to bw in order to reject the null hypothesis?A random sample of 50 students was asked to estimate how much money they spent on textbooks in a year. The sample skewness of these amounts was found to be 0.83 and the sample kurtosis was 3.98. Test at the 10% level the null hypothesis that the population dis- tribution of amounts spent is normal.
- Use the following results obtained from a simple linear regression analysis with 12 observations. Y = 37.2895- (1.2024)X Sb = 0.2934 Test to determine if there is a significant negative relationship between the independent and dependent variables at alpha= .05. Give the resulting conclusion. a. is rejected. B.cannot be tested with the given information. c. is not rejected. D. is not an appropriate null hypothesis for this situation.See the attached image for the introduction. In terms of variables xi and parameters βi, write the null and alternative hypotheses for testing whether, after including Price/Square Feet(x2) in the model already, the further incorporation of the other 2 explanatory variables (x1, x3) adds any useful information for explaining pricey. Also, give the value of the F statistic and its degrees of freedom (df).the null and alternative hypothesis are given. h0: p= 0.84 h1: pgreater than .84 determine left, right or two tailed and the parameter that is being tested
- What type of statistical test are you conducting if h1 states that the parameter is greater than the value claimed in h0? a) left-tailed b) right-tailed c) two-tailed d) dove-tailedGiven the Data:Test the hypothesis that p(rho)xy is not equal to 0 at the 0.05 level of significance.If the df value for a two tailed test with alpha =0.05 were to increase from df=5 to df=22,what would happen to the critical values for t?