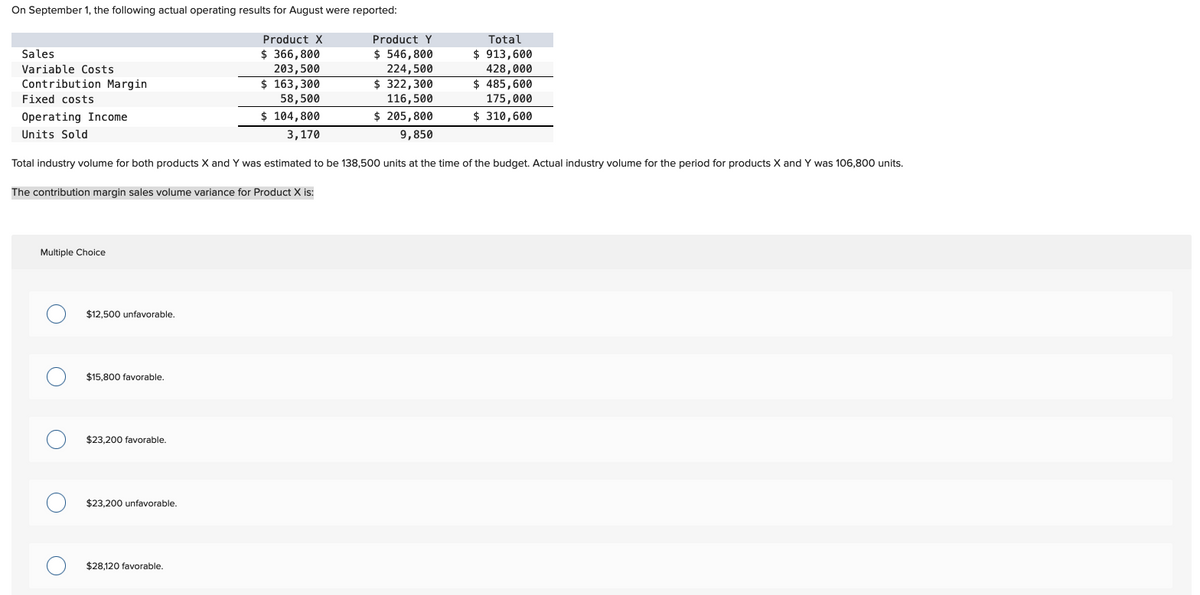
On September 1, the following actual operating results for August were reported: Product X $366,800 203,500 $ 163,300 58,500 $ 104,800 3,170 Product Y $ 546,800 224,500 $ 322,300 116,500 $ 205,800 9,850 Total industry volume for both products X and Y was estimated to be 138,500 units at the time of the budget. Actual industry volume for the period for products X and Y was 106,800 units. The contribution margin sales volume variance for Product X is: Sales Variable Costs Contribution Margin Fixed costs Operating Income Units Sold Multiple Choice $12,500 unfavorable. $15,800 favorable. $23,200 favorable. $23,200 unfavorable. Total $ 913,600 428,000 $ 485,600 175,000 $310,600 $28,120 favorable.


Master Budget
A master budget can be defined as an estimation of the revenue earned or expenses incurred over a specified period of time in the future and it is generally prepared on a periodic basis which can be either monthly, quarterly, half-yearly, or annually. It helps a business, an organization, or even an individual to manage the money effectively. A budget also helps in monitoring the performance of the people in the organization and helps in better decision-making.
Sales Budget and Selling
A budget is a financial plan designed by an undertaking for a definite period in future which acts as a major contributor towards enhancing the financial success of the business undertaking. The budget generally takes into account both current and future income and expenses.

Step by step
Solved in 3 steps


