On the basis of the above data, you are required to calculate the following ratios and interpret them as briefly as possible: 1) Current Ratio. 2) Gross Profit Ratio.
On the basis of the above data, you are required to calculate the following ratios and interpret them as briefly as possible: 1) Current Ratio. 2) Gross Profit Ratio.

MATLAB: An Introduction with Applications
6th Edition
ISBN:9781119256830
Author:Amos Gilat
Publisher:Amos Gilat
Chapter1: Starting With Matlab
Section: Chapter Questions
Problem 1P

Related questions
Question
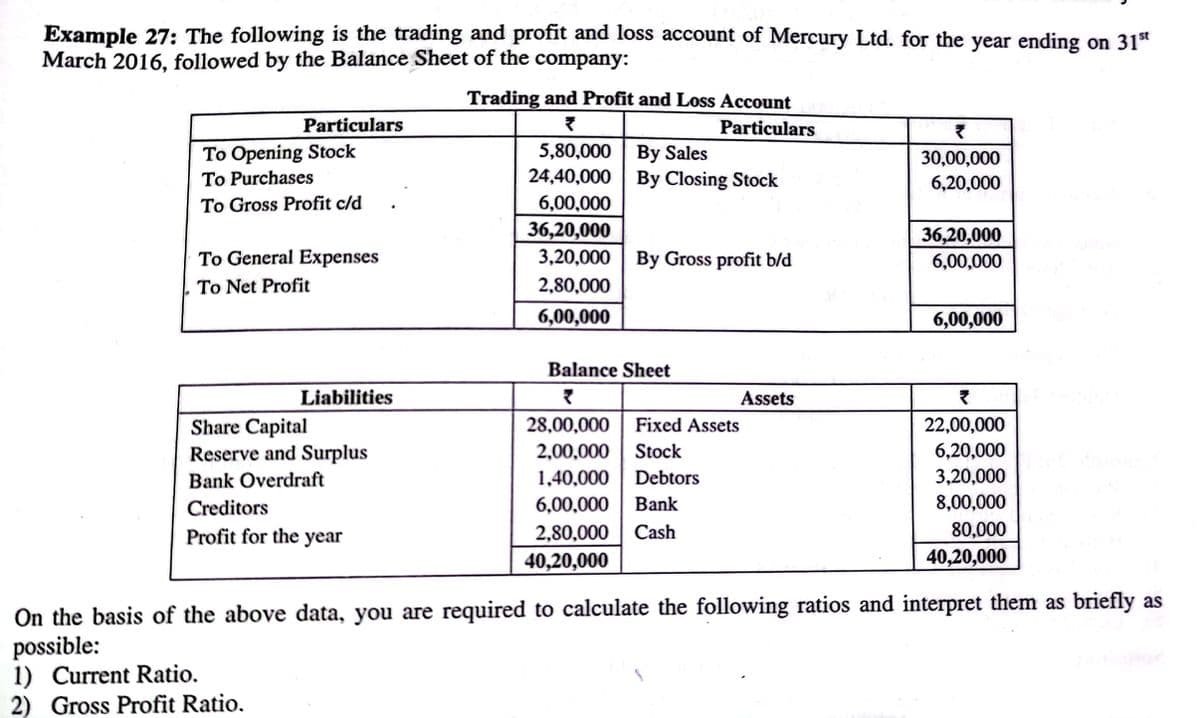
Transcribed Image Text:Example 27: The following is the trading and profit and loss account of Mercury Ltd. for the year ending on 31"
March 2016, followed by the Balance Sheet of the company:
Trading and Profit and Loss Account
Particulars
Particulars
5,80,000 | By Sales
24,40,000 | By Closing Stock
To Opening Stock
30,00,000
To Purchases
6,20,000
To Gross Profit c/d
6,00,000
36,20,000
3,20,000| By Gross profit b/d
36,20,000
To General Expenses
6,00,000
To Net Profit
2,80,000
6,00,000
6,00,000
Balance Sheet
Liabilities
Assets
28,00,000| Fixed Assets
2,00,000 | Stock
1,40,000 | Debtors
6,00,000 | Bank
2,80,000 | Cash
40,20,000
22,00,000
Share Capital
Reserve and Surplus
6,20,000
Bank Overdraft
3,20,000
Creditors
8,00,000
Profit for the year
80,000
40,20,000
On the basis of the above data, you are required to calculate the following ratios and interpret them as briefly as
possible:
1) Current Ratio.
2) Gross Profit Ratio.
Expert Solution
This question has been solved!
Explore an expertly crafted, step-by-step solution for a thorough understanding of key concepts.

Step by step
Solved in 2 steps with 2 images

Recommended textbooks for you
MATLAB: An Introduction with Applications
Statistics
ISBN:
9781119256830
Author:
Amos Gilat
Publisher:
John Wiley & Sons Inc

Probability and Statistics for Engineering and th…
Statistics
ISBN:
9781305251809
Author:
Jay L. Devore
Publisher:
Cengage Learning

Statistics for The Behavioral Sciences (MindTap C…
Statistics
ISBN:
9781305504912
Author:
Frederick J Gravetter, Larry B. Wallnau
Publisher:
Cengage Learning
MATLAB: An Introduction with Applications
Statistics
ISBN:
9781119256830
Author:
Amos Gilat
Publisher:
John Wiley & Sons Inc
Probability and Statistics for Engineering and th…
Statistics
ISBN:
9781305251809
Author:
Jay L. Devore
Publisher:
Cengage Learning
Statistics for The Behavioral Sciences (MindTap C…
Statistics
ISBN:
9781305504912
Author:
Frederick J Gravetter, Larry B. Wallnau
Publisher:
Cengage Learning

Elementary Statistics: Picturing the World (7th E…
Statistics
ISBN:
9780134683416
Author:
Ron Larson, Betsy Farber
Publisher:
PEARSON

The Basic Practice of Statistics
Statistics
ISBN:
9781319042578
Author:
David S. Moore, William I. Notz, Michael A. Fligner
Publisher:
W. H. Freeman

Introduction to the Practice of Statistics
Statistics
ISBN:
9781319013387
Author:
David S. Moore, George P. McCabe, Bruce A. Craig
Publisher:
W. H. Freeman