On the following graph, use the green point ((triangle symbol) to plot the annual total revenue when the market price is $50, $75, $100, $125, $150, $175, and $200 per bike.
On the following graph, use the green point ((triangle symbol) to plot the annual total revenue when the market price is $50, $75, $100, $125, $150, $175, and $200 per bike.

Chapter13: Monopoly And Antitrust
Section: Chapter Questions
Problem 13P

Related questions
Question
Please help answer the following questions
Transcribed Image Text:HomeworkS
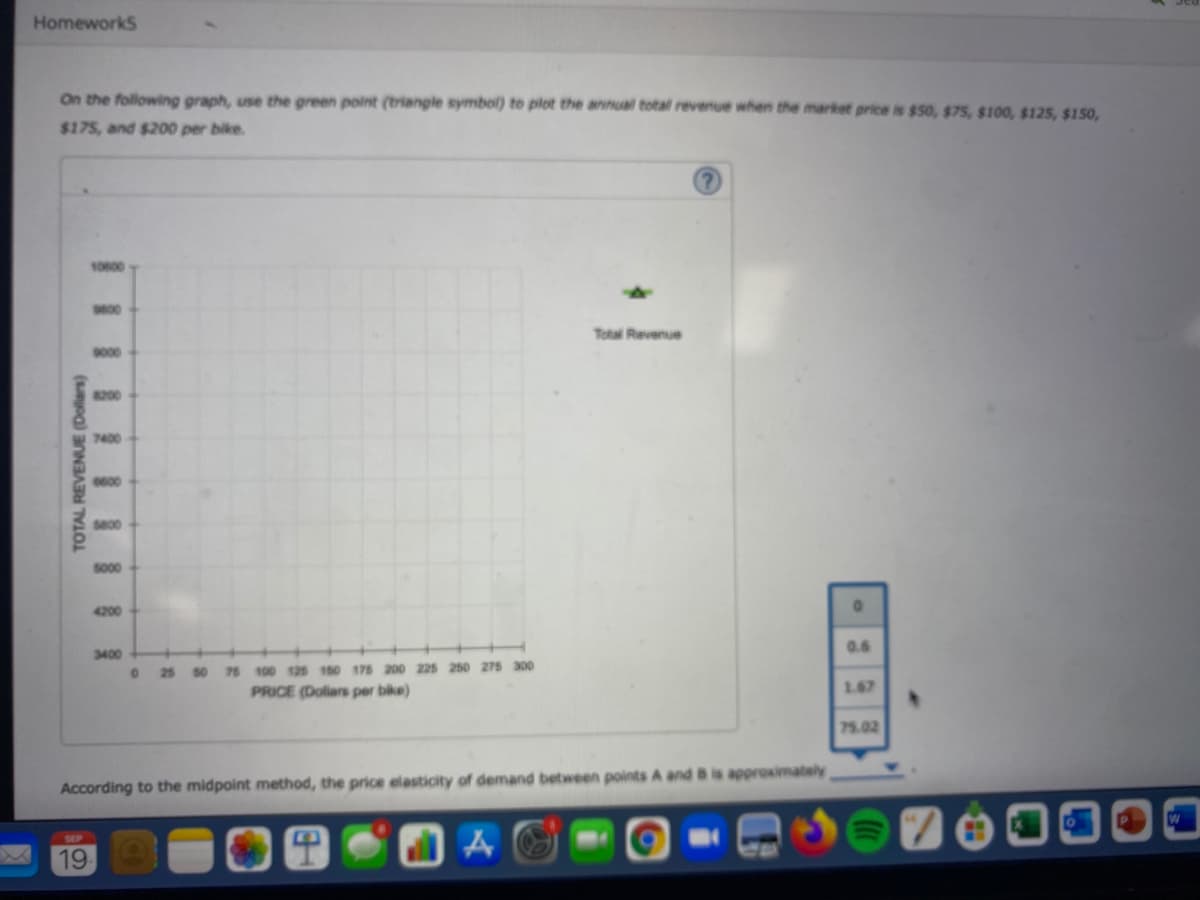
On the following graph, use the green point (triangle symbol) to plot the annual total revenue when the market price is $50, $75, $100, $125, $150,
$175, and $200 per bike.
10000
s800
Total Revenue
s000
200
7400
se00
so00
4200
0.6
3400
25 50 76 100 125 50 175 200 225 250 275 300
PRICE (Dollars per bike)
1.67
75.02
According to the midpoint method, the price elasticity of demand between points A and B is approximately
SEP
19
TOTAL REVENUE (Dollars)
Transcribed Image Text:Q Sea
Homework5
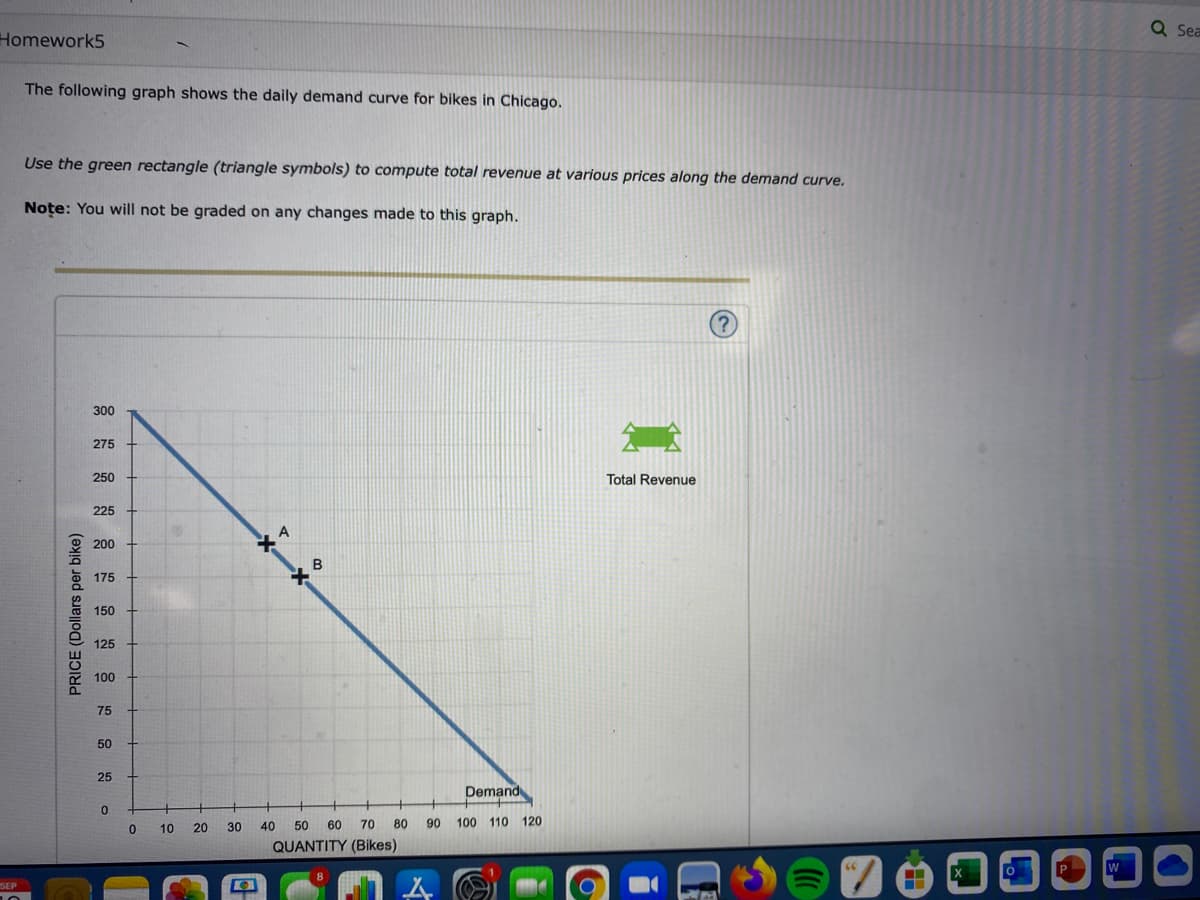
The following graph shows the daily demand curve for bikes in Chicago.
Use the green rectangle (triangle symbols) to compute total revenue at various prices along the demand curve.
Noțe: You will not be graded on any changes made to this graph.
300
275
250
Total Revenue
225
200
175
150
125
100
75
50
25
Demand
30
40
50
60
70
80
90
100 110 120
10
20
QUANTITY (Bikes)
SEP
PRICE (Dollars per bike)
Expert Solution
This question has been solved!
Explore an expertly crafted, step-by-step solution for a thorough understanding of key concepts.

This is a popular solution!

Trending now
This is a popular solution!

Step by step
Solved in 2 steps with 1 images

Recommended textbooks for you
Exploring Economics
Economics
ISBN:
9781544336329
Author:
Robert L. Sexton
Publisher:
SAGE Publications, Inc


Principles of Economics 2e
Economics
ISBN:
9781947172364
Author:
Steven A. Greenlaw; David Shapiro
Publisher:
OpenStax
Exploring Economics
Economics
ISBN:
9781544336329
Author:
Robert L. Sexton
Publisher:
SAGE Publications, Inc
Principles of Economics 2e
Economics
ISBN:
9781947172364
Author:
Steven A. Greenlaw; David Shapiro
Publisher:
OpenStax

Essentials of Economics (MindTap Course List)
Economics
ISBN:
9781337091992
Author:
N. Gregory Mankiw
Publisher:
Cengage Learning

