Only parts C and D please. Thank you.

Holt Mcdougal Larson Pre-algebra: Student Edition 2012
1st Edition
ISBN:9780547587776
Author:HOLT MCDOUGAL
Publisher:HOLT MCDOUGAL
Chapter11: Data Analysis And Probability
Section11.4: Collecting Data
Problem 2E

Related questions
Question
Only parts C and D please. Thank you.
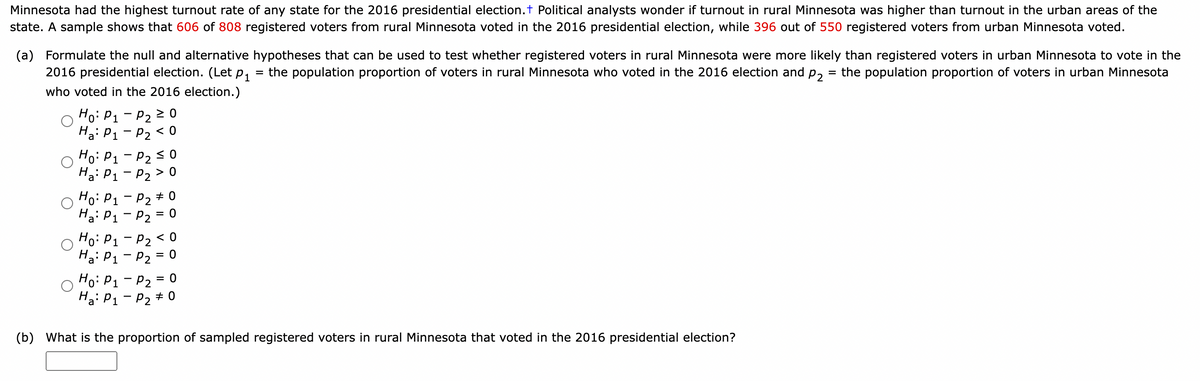
Transcribed Image Text:Minnesota had the highest turnout rate of any state for the 2016 presidential election. + Political analysts wonder if turnout in rural Minnesota was higher than turnout in the urban areas of the
state. A sample shows that 606 of 808 registered voters from rural Minnesota voted in the 2016 presidential election, while 396 out of 550 registered voters from urban Minnesota voted.
(a) Formulate the null and alternative hypotheses that can be used to test whether registered voters in rural Minnesota were more likely than registered voters in urban Minnesota to vote in the
2016 presidential election. (Let P₁ the population proportion of voters in rural Minnesota who voted in the 2016 election and P2 = the population proportion of voters in urban Minnesota
=
who voted in the 2016 election.)
Ho: P₁
Ha: P₁
Ho: P₁
Ha: P₁
Ho: P₁
Ha: P₁
Ho: P₁
Ha: P₁
P₂ ≥ 0
P₂ <0
-
P₂ ≤ 0
P₂ > 0
Ho: P₁ - P2 <0
Ha: P₁ P₂ = 0
P₂ #0
P₂ = 0
P₂ = 0
P₂ #0
(b) What is the proportion of sampled registered voters in rural Minnesota that voted in the 2016 presidential election?
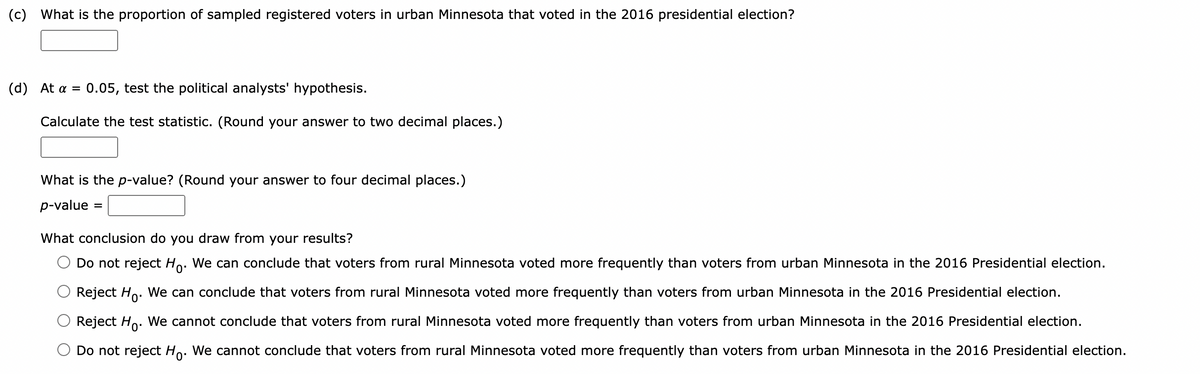
Transcribed Image Text:(c) What is the proportion of sampled registered voters in urban Minnesota that voted in the 2016 presidential election?
(d) At a = 0.05, test the political analysts' hypothesis.
Calculate the test statistic. (Round your answer to two decimal places.)
What is the p-value? (Round your answer to four decimal places.)
p-value
=
What conclusion do you draw from your results?
Do not reject Ho. We can conclude that voters from rural Minnesota voted more frequently than voters from urban Minnesota in the 2016 Presidential election.
Reject Ho. We can conclude that voters from rural Minnesota voted more frequently than voters from urban Minnesota in the 2016 Presidential election.
Reject Ho. We cannot conclude that voters from rural Minnesota voted more frequently than voters from urban Minnesota in the 2016 Presidential election.
Do not reject Ho. We cannot conclude that voters from rural Minnesota voted more frequently than voters from urban Minnesota in the 2016 Presidential election.
Expert Solution
This question has been solved!
Explore an expertly crafted, step-by-step solution for a thorough understanding of key concepts.

This is a popular solution!

Trending now
This is a popular solution!

Step by step
Solved in 3 steps

Recommended textbooks for you
Holt Mcdougal Larson Pre-algebra: Student Edition…
Algebra
ISBN:
9780547587776
Author:
HOLT MCDOUGAL
Publisher:
HOLT MCDOUGAL

College Algebra (MindTap Course List)
Algebra
ISBN:
9781305652231
Author:
R. David Gustafson, Jeff Hughes
Publisher:
Cengage Learning

Holt Mcdougal Larson Pre-algebra: Student Edition…
Algebra
ISBN:
9780547587776
Author:
HOLT MCDOUGAL
Publisher:
HOLT MCDOUGAL
College Algebra (MindTap Course List)
Algebra
ISBN:
9781305652231
Author:
R. David Gustafson, Jeff Hughes
Publisher:
Cengage Learning