8. Compute the arithmetic mean. 9. Compute the standard deviation. 10. Construct a histogram to display the distribution of astigmatism.
8. Compute the arithmetic mean. 9. Compute the standard deviation. 10. Construct a histogram to display the distribution of astigmatism.

Holt Mcdougal Larson Pre-algebra: Student Edition 2012
1st Edition
ISBN:9780547587776
Author:HOLT MCDOUGAL
Publisher:HOLT MCDOUGAL
Chapter11: Data Analysis And Probability
Section11.5: Interpreting Data
Problem 1C

Related questions
Question
100%
SKIP THIS IF YOU ALREADY ANSWERED THIS. I WILL ONLY UPVOTE IF IT IS TYPEWRITTEN. FOLLOW THE INSTRUCTIONS AND DO IT COMPLETELY. DOWNVOTE IF YOU ANSWERED THIS AGAIN. THANK YOU
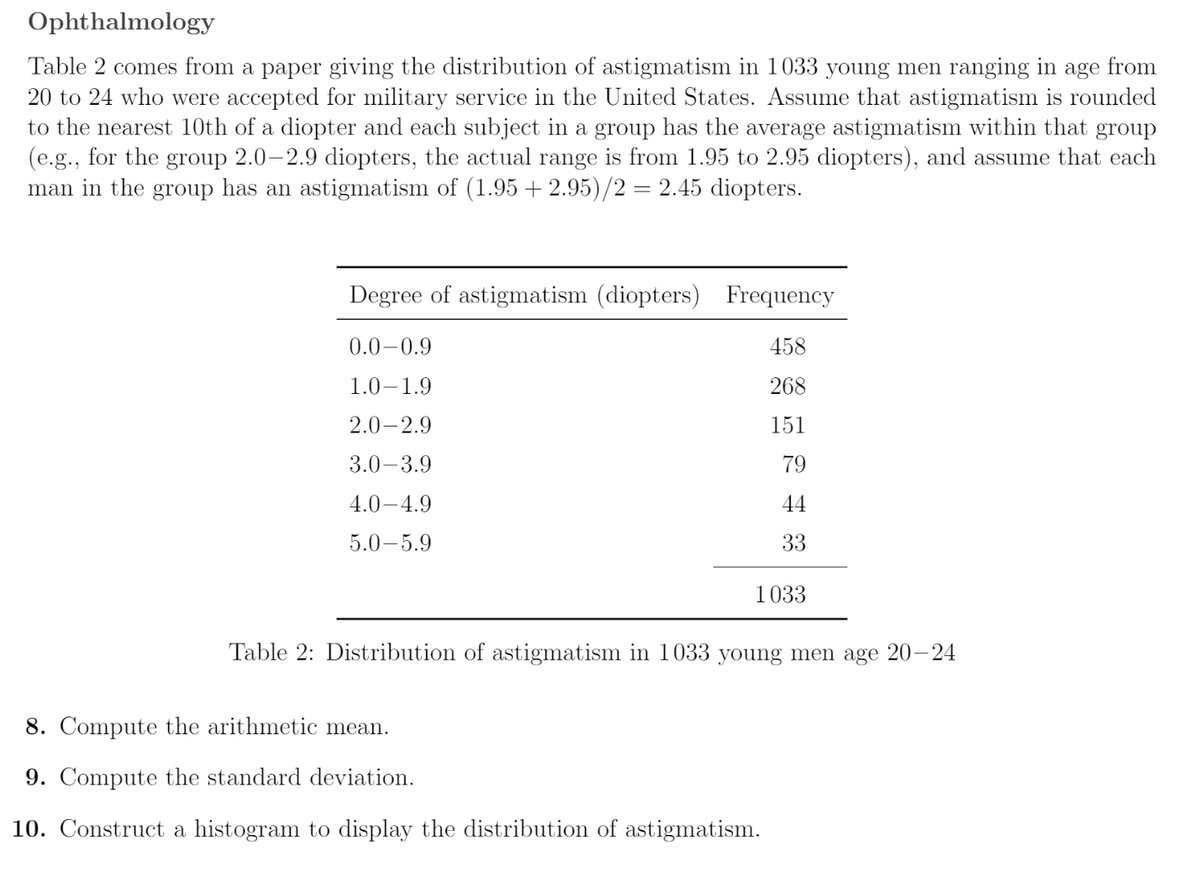
Transcribed Image Text:Ophthalmology
Table 2 comes from a paper giving the distribution of astigmatism in 1033 young men ranging in age from
20 to 24 who were accepted for military service in the United States. Assume that astigmatism is rounded
to the nearest 10th of a diopter and each subject in a group has the average astigmatism within that group
(e.g., for the group 2.0-2.9 diopters, the actual range is from 1.95 to 2.95 diopters), and assume that each
man in the group has an astigmatism of (1.95 + 2.95)/2 = 2.45 diopters.
Degree of astigmatism (diopters) Frequency
0.0-0.9
458
1.0-1.9
268
2.0-2.9
151
3.0-3.9
79
4.0-4.9
44
5.0-5.9
33
1033
Table 2: Distribution of astigmatism in 1033 young men age 20-24
8. Compute the arithmetic mean.
9. Compute the standard deviation.
10. Construct a histogram to display the distribution of astigmatism.
Expert Solution
This question has been solved!
Explore an expertly crafted, step-by-step solution for a thorough understanding of key concepts.

Step by step
Solved in 4 steps with 1 images

Recommended textbooks for you
Holt Mcdougal Larson Pre-algebra: Student Edition…
Algebra
ISBN:
9780547587776
Author:
HOLT MCDOUGAL
Publisher:
HOLT MCDOUGAL

Glencoe Algebra 1, Student Edition, 9780079039897…
Algebra
ISBN:
9780079039897
Author:
Carter
Publisher:
McGraw Hill
Holt Mcdougal Larson Pre-algebra: Student Edition…
Algebra
ISBN:
9780547587776
Author:
HOLT MCDOUGAL
Publisher:
HOLT MCDOUGAL
Glencoe Algebra 1, Student Edition, 9780079039897…
Algebra
ISBN:
9780079039897
Author:
Carter
Publisher:
McGraw Hill