| Current Year Previous Year Current assets $2,500,000 $1,840,000 Property, plant, and equipment 5,600,000 6,072,000 Intangible assets 1,900,000 1,288,000 Current liabilities 2,000,000 1,380,000 Long-term liabilities 3,400,000 3,680,000 Common stock 920,000 920,000 Retained earnings 3,680,000 3,220,000


Q: Vertical Analysis of Balance Sheet Balance sheet data for Alvarez Company on December 31, the end of…
A: Solution: Alvaraz Company Comparative Balance Sheet For the years ended Dec 31 Current…
Q: Long-Term Solvency Analysis The following information was taken from Celebrate Company's balance…
A: A. RATIO OF FIXED ASSETS TO LONG-TERM LIABILITIES = FIXED ASSET / LONG-TERM LIABILITIES B. RATIO…
Q: Balance sheet data for Novak Company on December 31, the end of two recent fiscal years, follows:…
A: Financial statements of a firm include income statement, balance sheet, cash flow statement and…
Q: Vertical Analysis of Balance Sheet Vertical Analysis of Balance Sheet Balance sheet data for Alvarez…
A: Balance sheet: This statement shows the assets and liabilities held by a company on a particular…
Q: Long-Term Solvency Analysis The following information was taken from Celebrate Company's balance…
A: Ratio analysis is used to analyze the financial statement and measuring the financial situation. It…
Q: The balance sheet data of Randolph Company for two recent years appears below: Assets: Year 2…
A: Financial analysis is widely used by companies to determine the profitability of the business and…
Q: Long-Term Solvency Analysis The following information was taken from Station Company's balance…
A: Ans.a) Ratio of Fixed assets to long term Liabilities = Fixed Asset / Long term debt b) Ratio of…
Q: Condensed data taken from the ledger of St. Louis Company at December 31, for the current and…
A: Horizontal analysis is prepared to calculate the variance from previous year by showing…
Q: The following information was taken from Jacobus Company’s balance sheet: Fixed assets (net)…
A: Ratio of fixed assets to long term liabilities = Fixed assets (net) / Long-term liabilities Ratio…
Q: Current Position Analysis
A: We know that working capital is cash that is used to run day to day activities of the business. It…
Q: Compute the quick ratio on December 31 for each year. Round to one decimal place. 20Y4 20Y3 Quick…
A: The Qúick ratio measures the company ability to meet it so term and urgent need so it measure the…
Q: Financial data for Joel de Paris, Inc., for last year follow: Joel de Paris, Inc.Balance Sheet…
A: 1. Operating assets comprise of assets which are used by the business in ordinary course to generate…
Q: Selected current year end financial statement of Cabot corporation follow. (all sales were on credit…
A: Hello. Since your question has multiple sub-parts, we will solve first three sub-parts for you. If…
Q: The balance sheet data below for Randolph Company for two recent years. Assets Year 2 Year 1…
A: Part-A Increase/(decrease) = Year 2 - Year 1 Increase/(decrease) percentage = Increase /…
Q: Adieu Company reported the following current assets and current liabilities for two recent years:…
A: Ratio Analysis: Liquidity ratios, solvency ratios, profitability ratios, efficiency ratios, and…
Q: Condensed data taken from the ledger of St. Louis Company at December 31, for the current and…
A: Horizontal analysis is prepared to calculate the variance from previous year by showing…
Q: Six Measures of Solvency or Profitability The following data were taken from the financial…
A: Ratio: It is the relation between the two numbers of the same kind. It is usually expressed as “a”…
Q: Vertical Analysis of Balance Sheet Balance sheet data for Kwan Company on December 31, the end of…
A: Comparative Balance Sheet depicts the financial position (balance sheet) for 2 or more reporting…
Q: Long-Term Solvency Analysis The following information was taken from Acme Company's balance sheet:…
A: Here in this question, we are required to calculate fixed asset to long term liabilities ratio and…
Q: Balance sheet data for Alvarez Company on December 31, the end of two recent fiscal years, follow:…
A: Comparative balance sheet used to compare the financial statement of two or more periods. It is…
Q: Prepare a comparative balance sheet for both years, stating each asset as a percent of total assets…
A: The comparative balance sheet is a financial statement that shows accounting estimates for assets,…
Q: Prepare a Statement of Stockholders’ Equity. Bluebird Products, Inc. provided the following…
A: Income statement is the part of financial statements of a firm which need to be published for each…
Q: Prepare a comparative balance sheet for both years, stating each asset as a percent of total assets…
A: A comparative analysis of financial statements is used to determine the financial performance and…
Q: Use the following information for the Exercises below. (Algo) [The following information applies to…
A: The question is related to the Ratio Analysis. The Net profit ratio is calculated with the help of…
Q: Balance sheet data for Kwan Company on December 31, the end of two recent fiscal years, follow:…
A: Vertical analysis: Vertical analysis is prepared for each item to shows as a percentage of some…
Q: Quick Ratio Nabors Company reported the following current assets and liabilities for December 31 for…
A:
Q: Adieu Company reported the following current assets and liabilities for December 31 for two recent…
A: a. Compute the quick ratio for December 31, Current year and previous year.
Q: Joel de Paris, Inc. Balance Sheet Beginning Balance Ending Balance Assets Cash $ 140,000 $…
A: Return on investment (ROI) of the company shows the income earned during the year on the basis of…
Q: Vertical Analysis of Balance Sheet Balance sheet data for Kwan Company on December 31, the end of…
A: Vertical analysis: The comparison of an item of a financial statement against the total amount of…
Q: Question Content Area
A: Assets are resources that are controlled which results from prior transactions that are expected to…
Q: Balance sheet data for Alvarez Company on December 31, the end of two recent fiscal years, follows:…
A: A comparative balance sheet is a statement that shows the financial position of an organization over…
Q: Ratio of liabilities to stockholders equity intrest earned The following data were taken from the…
A: Ratio of liabilities to stockholder equity helps in determining the proportion of funding the…
Q: Long-Term Solvency Analysis The following information was taken from Celebrate Company's balance…
A: Ratio analysis is a method of measuring the financial position of the organization with different…
Q: Vertical Analysis of Balance Sheet Balance sheet data for Alvarez Company on December 31, the end of…
A: Comparative balance sheet is a kind of balance sheet that encourage investors to analyze performance…
Q: Balance sheet data for Kwan Company on December 31, the end of two recent fiscal years, follow:…
A: Comparative balance sheets are used to compare data of one or more years. It is also helpful in…
Q: Balance sheet data for Kwan Company on December 31, the end of two recent fiscal years, follow:…
A: Vertical analysis is the important analysis technique that is being used in business. Under this,…
Q: Return on total assets A company reports the following income statement and balance sheet…
A: Return on assets: Return on assets is the financial ratio which determines the amount of net income…
Q: The balance sheet data of Randolph Company for two recent years appears below: Assets: Year 2 Year…
A: Comparative balance sheet used to compare the financial statement of two or more periods. It is…
Q: The following information was taken from Station Company's balance sheet: Fixed assets (net)…
A: Ratio of fixed assets to long-term liabilities = Fixed assets/Long term liabilities Ratio of…
Q: Vertical Analysis of Balance Sheet Balance sheet data for Alvarez Company on December 31, the end…
A: Comparative analysis is used to compare the current year with the previous year.
Q: Balance sheet data for Alvarez Company on December 31, the end of two recent fiscal years, follow:…
A:
Q: Hello, how do I solve this problem? I attached the bottom part of the question and what it's asking…
A: (a) Determine the ratio of fixed assets to long term liabilities:
Q: Vertical Analysis of Balance Sheet Balance sheet data for Kwan Company on December 31, the end of…
A: ℅ will be calculated as follows (Item/ total asset or liabilities+shareholders equity) *100
Q: Vertical Analysis of Balance Sheet Balance sheet data for Alvarez Company on December 31, the end of…
A: In a vertical analysis of Balance Sheet, individual assets and libilities are expressed as a…
Q: Current Position Analysis The following data were taken from the balance sheet of Nilo Company at…
A: Working capital indicate the short term liquid funds available after meeting all the current…
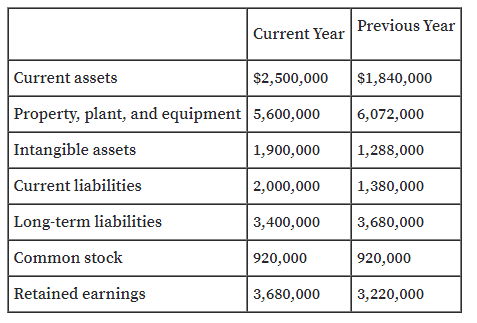
Vertical analysis of
Balance shed data for Alvarez Company on December 31. the end of two recent fiscal years, follow:
Prepare a comparative balance sheet for both years, stating each asset as
a percent of total assets and each liability and
as a percent of the total liabilities and stockholders' equity. (Round
percentages to one decimal place.)


Trending now
This is a popular solution!

Step by step
Solved in 2 steps with 2 images


- Twenty metrics of liquidity, solvency, and profitability The comparative financial statements of Automotive Solutions Inc. are as follows. The market price of Automotive Solutions Inc. common stock was $119.70 on December 31, 20Y8 Instructions Asset turnoverRefer to the following data of OCT2023CPACompany: Assets to be realized 1,375,000Assets acquired 825,000 Liabilities liquidated 1,875,000Assets realized 1,200,000Liabilities not liquidated 1,700,000 Assets not realized 1,375,000Llabilities assumed 1,625,000Llabilities to be liquidated 2,250,000 Supplementary charges 3,125,000 Supplementary credits 2,800,000 Compute the beginning cash balance assuming that the ending balance of ordinary share and retained earnings are P1,200,000 and (400,000), respectively26. Jamison Corp.'s balance sheet accounts as of December 31, 2021 and 2020 and information relating to 2021 activities are presented below. December 31, 2021 2020 Assets Cash $ 440,000 $ 200,000 Short-term investments 600,000 — Accounts receivable (net) 1,020,000 1,020,000 Inventory 1,380,000 1,200,000 Long-term investments…
- Orbit Limited : Statement of Financial Position as at 31 December 2022 2021 Non-current Assets R11 810 000 R7 560 000 Property, Plant, Equipment R10 025 000 R6 250 000 Investments R1 785 000 R1 310 000 Current Assets R4 190 000 R4 690 000 Inventories R 1 875 000 R2 350 000 Account Receivable R1 925 000 R2 200 000 Cash R390 000 R140 000 Toatal Assets R16 000 000 R12 250 000 Equities & Liabilities Equity ? ? Oridanary share capital R5 480 000 R3 680 000 Retained earnings ? ? Non-current Liabilities R4 500 000 R3 800 000 Loan (20% p.a) R4 500 000 R3 800 000 Current Liabilities R2 300 000 R1 500 000 Accounts payable? R2 300 000 R1 500 000 Calculate the increase in the retained earnings over the two-year period.The comparative statement of financial position for Moose Jaw Ltd. is as follows:Moose Jaw Ltd.Comparative Statement of Financial PositionAs at December 312021 2020Cash $20,500 $12,500Accounts receivable 34,000 25,500Inventories 20,000 30,000Prepaid insurance 2,500 2,000Equipment 102,000 90,000Accumulated depreciation - equipment (22,500) (12,500)Total assets $156,500 $147,500Accounts payable $23,000 $20,000Interest payable 2,000 3,000Wages payable 4,000 2,000Income taxes payable 4,000 5,000Long-term note payable 30,000 34,500Common shares 65,000 65,000Retained earnings 28,500 18,000Total liabilities and equity $156,500 $147,500More information about Moose Jaw’s operations for 2021:• A machine which the company paid $10,000 for was sold for a gain of$1,000. The equipment’s accumulated depreciation was $7,000.• The company had net income for of $13,500.RequiredConstruct the operating activities section of Moose Jaw Ltd.’s statement of cashflows using the indirect method. Use proper…18 eppertree Company’s financial statements on December 31, 2021, showed the following: Net Sales $ 550,000 Fixed Assets, January 1 $ 146,000 Fixed Assets, December 31 $ 134,000 Total Assets, January 1 $ 194,000 Total Assets, December 31 $ 200,000 What is the fixed asset turnover for 2021? Multiple Choice 3.93 2.60 4.10 2.79
- Hansel Corporation’s condensed balance sheets appear below: 20X3 20X2 20X1 Assets: Current assets $ 55,000 $ 56,500 $ 70,000 Plant & equipment, net 495,000 410,000 440,000 Intangible assets, net 20,000 27,500 40,000 Total assets $ 570,000 $ 494,000 $ 550,000 Liabilities & Stockholders’ Equity: Current liabilities $ 40,000 $ 35,000 $ 32,500 Long-term liabilities 395,000 310,000 375,000 Stockholders’ equity 135,000 149,000 142,500 Total liabilities & equity $ 570,000 $ 494,000 $ 550,000 In a trend balance sheet for 20X3, long-term liabilities are expressed as Multiple Choice 69.3% 100.0% 105.3% 127.4%Patel Corporation Balance Sheet December 31, 2021 $ 630,000 189,000 275,000 1,875,000 Cash $ Accounts receivable ( net) Inventories Plant and equipment net of depreciation Patents Other intangible assets Total Assets $ 750,000 350,000 Accounts payable 1.950,000 Income taxes payable 2,439,000 Miscellaneous accrued payables Bonds payable (8% , due 2023) 1,963,000 Preferred slock ($100 par, 6% 261,000 cumulative nonparticipating) 75,000 Common stock (no par, 60,000 7,058.000 shares authorized, issued and outstanding) Retained earnings Treasury stock- - 1.500 shares of preferred Total Equities 1,125,000 2,439,000 (225,000) underline 5 7,058,000 Patel Corporation Income Statement Year ended December 31, 2021 Net sales $ Cose goods sold Gross profit Operating expenses (including bond interest expense) Income before income taxes Income tax Net income 9,000,000 6,000,000 3,000,000 1,500,000 1,500,000 450,000 1, 05 Additional information: There are no preferred dividends in arrears, the…Patel Corporation Balance Sheet December 31, 2021 $ 630,000 189,000 275,000 1,875,000 Cash $ Accounts receivable ( net) Inventories Plant and equipment net of depreciation Patents Other intangible assets Total Assets $ 750,000 350,000 Accounts payable 1.950,000 Income taxes payable 2,439,000 Miscellaneous accrued payables Bonds payable (8% , due 2023) 1,963,000 Preferred slock ($100 par, 6% 261,000 cumulative nonparticipating) 75,000 Common stock (no par, 60,000 7,058.000 shares authorized, issued and outstanding) Retained earnings Treasury stock- - 1.500 shares of preferred Total Equities 1,125,000 2,439,000 (225,000) underline 5 7,058,000 Patel Corporation Income Statement Year ended December 31, 2021 Net sales $ Cose goods sold Gross profit Operating expenses (including bond interest expense) Income before income taxes Income tax Net income 9,000,000 6,000,000 3,000,000 1,500,000 1,500,000 450,000 1, 05 Additional information: There are no preferred dividends in arrears, the…
- Condensed financial data of Shamrock, Inc. follow. Shamrock, Inc.Comparative Balance SheetsDecember 31 Assets 2022 2021 Cash $ 242,400 $ 145,200 Accounts receivable 263,400 114,000 Inventory 337,500 308,550 Prepaid expenses 85,200 78,000 Long-term investments 414,000 327,000 Plant assets 855,000 727,500 Accumulated depreciation (150,000 ) (156,000 ) Total $2,047,500 $1,544,250 Liabilities and Stockholders’ Equity Accounts payable $ 306,000 $ 201,900 Accrued expenses payable 49,500 63,000 Bonds payable 330,000 438,000 Common stock 660,000 525,000 Retained earnings 702,000 316,350 Total $2,047,500 $1,544,250 Shamrock, Inc.Income Statement DataFor the Year Ended December 31, 2022 Sales revenue…1.Presented below are the financial statements of KJ Electronics KJ Electronics Inc. Comparative Balance Sheets September 30 Assets 2021 2020 Current Assets Cash $92000 $42980 Short Term Investments 29500 22500 Accounts Receivable 56900 22300 Inventory 102,300 90220 Long Term Assets Long term Investments 96,300 103000 Equipment 198,000 215000 Accumulated depreciation- equipment (50000) (48000) Total $525,000 $448,000 Current Liabilities Accounts Payable $85,300 $30200 Accrued Expenses payable 26700 15000 Long Term Liabilities Bonds Payable 97,300 79,570 Stockholders’ Equity Common Stock 150,000 165500 Retained Earnings 165,700 157,730 Total $525,000 $448,000 KJ Electronics Inc. Income Statement For the Year Ended September 30, 2021 Sales Revenue Less: Sales Returns and Allowances Net…1. The balance sheets at the end of each of the first two years of operations indicate the following:20172016Total current assets$600,000$560,000Total investments60,00040,000Total property, plant, and equipment900,000700,000Total current liabilities125,00080,000Total long-term liabilities350,000250,000Preferred 9% stock, $100 par100,000100,000Common stock, $10 par600,000600,000Paid-in capital in excess of par--common stock60,00060,000Retained earnings325,000210,000Based on the above information, if net income is $130,000 and interest expense is $40,000 for 2017, and the market price is $40, what is the price-earnings ratio on common stock (round to one decimal place)?a. 14.9b. 19.8c. 17.3d. 18.4
