Vertical Analysis of Balance Sheet Balance sheet data for Alvarez Company on December 31, the end of two recent fiscal years, follows: Current Year Previous Year $300,630 $170,750 Current assets 510,160 478,100 Property, plant, and equipment 100,210 34,150 Intangible assets 191,310 116,110 Current liabilities 373,510 280,030 Long-term liabilities Common stock 81,990 75,130 Retained earnings 264,190 211,730 Prepare a comparative balance sheet for both years, stating each asset as a percent of total assets and each liability and stockholders' equity item as a percent of the total liabilities and stockholders' equity. If required, round percentages to one decimal place. Alvaraz Company Comparative Balance Sheet For the Years Ended December 31 Previous year Previous year Current year Percent Current year Amount Amount Percent Current assets $300,630 $170,750 Property, plant, and equipment 510,160 478,100 100,210 34,150 Intangible assets Total assets $911,000 $683,000 Current liabilities $191,310 $116,110 Long-term liabilities 373,510 280,030 Common stock 81,990 75,130 Retained earnings 264,190 211,730 Total liabilities and stockholders' $911,000 $683,000 equity 96
Vertical Analysis of Balance Sheet Balance sheet data for Alvarez Company on December 31, the end of two recent fiscal years, follows: Current Year Previous Year $300,630 $170,750 Current assets 510,160 478,100 Property, plant, and equipment 100,210 34,150 Intangible assets 191,310 116,110 Current liabilities 373,510 280,030 Long-term liabilities Common stock 81,990 75,130 Retained earnings 264,190 211,730 Prepare a comparative balance sheet for both years, stating each asset as a percent of total assets and each liability and stockholders' equity item as a percent of the total liabilities and stockholders' equity. If required, round percentages to one decimal place. Alvaraz Company Comparative Balance Sheet For the Years Ended December 31 Previous year Previous year Current year Percent Current year Amount Amount Percent Current assets $300,630 $170,750 Property, plant, and equipment 510,160 478,100 100,210 34,150 Intangible assets Total assets $911,000 $683,000 Current liabilities $191,310 $116,110 Long-term liabilities 373,510 280,030 Common stock 81,990 75,130 Retained earnings 264,190 211,730 Total liabilities and stockholders' $911,000 $683,000 equity 96

Managerial Accounting
15th Edition
ISBN:9781337912020
Author:Carl Warren, Ph.d. Cma William B. Tayler
Publisher:Carl Warren, Ph.d. Cma William B. Tayler
Chapter16: Financial Statement Analysis
Section: Chapter Questions
Problem 4E

Related questions
Question
100%
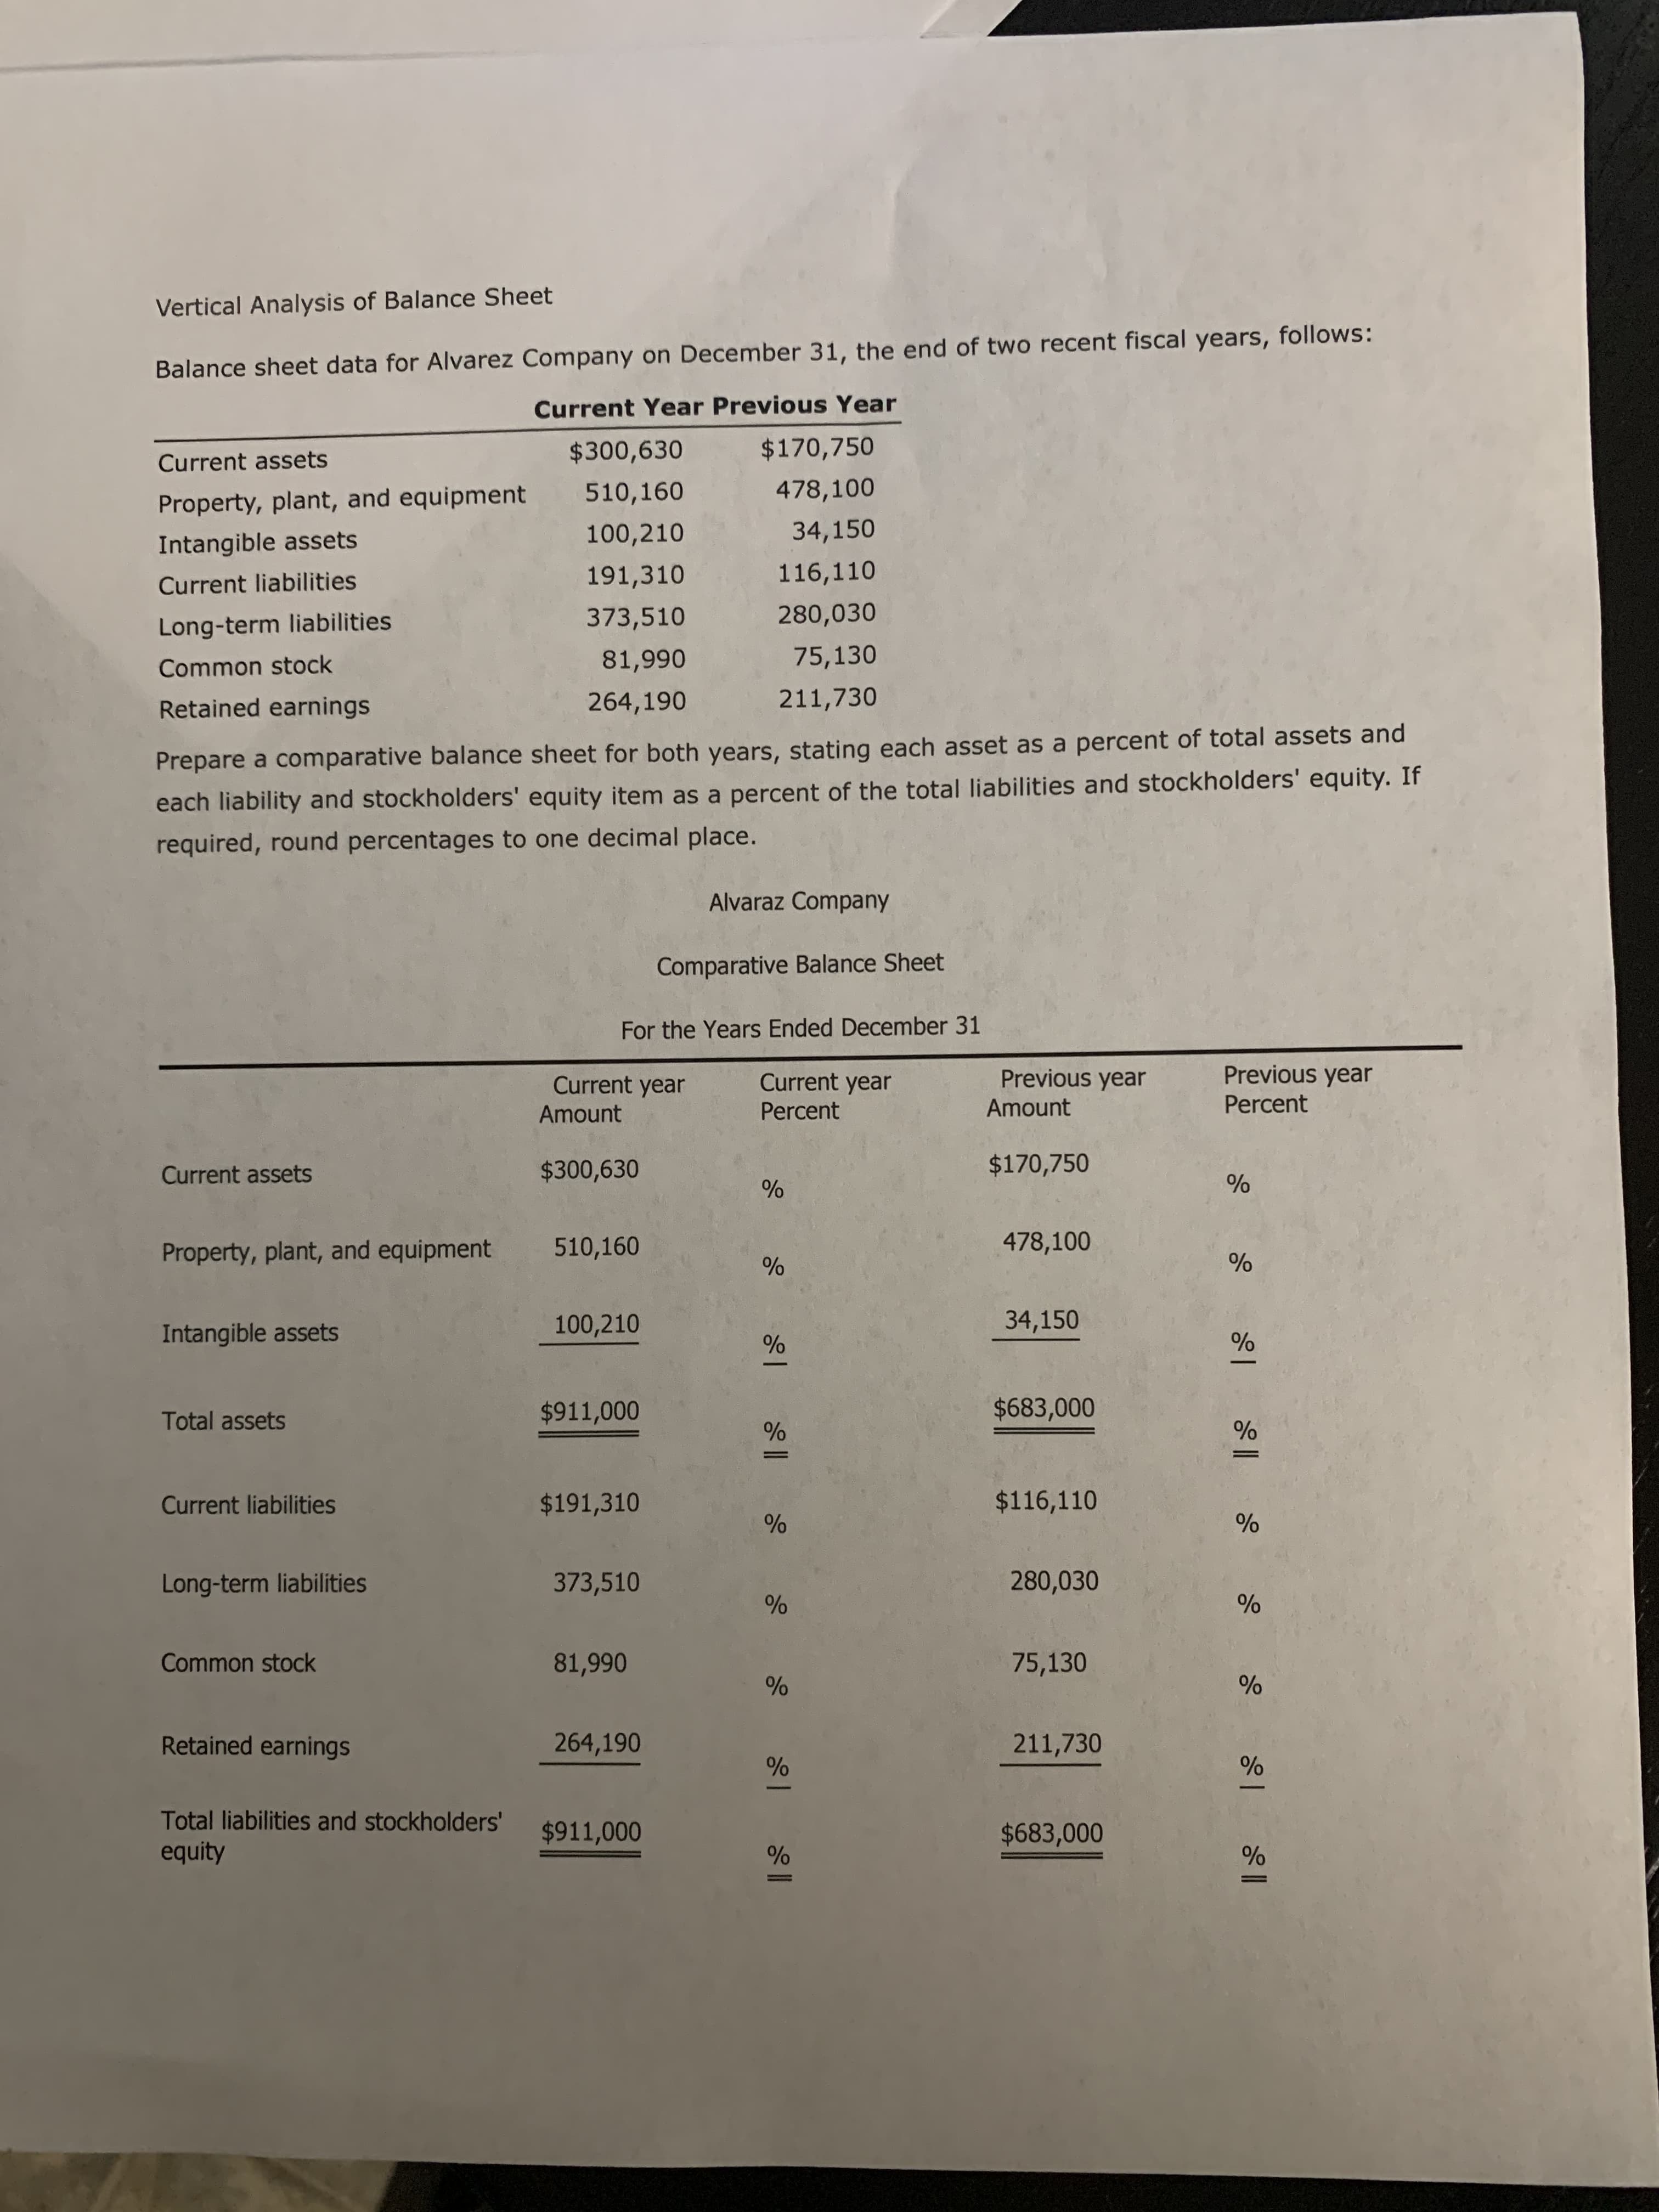
Transcribed Image Text:Vertical Analysis of Balance Sheet
Balance sheet data for Alvarez Company on December 31, the end of two recent fiscal years, follows:
Current Year Previous Year
$300,630
$170,750
Current assets
510,160
478,100
Property, plant, and equipment
100,210
34,150
Intangible assets
191,310
116,110
Current liabilities
373,510
280,030
Long-term liabilities
Common stock
81,990
75,130
Retained earnings
264,190
211,730
Prepare a comparative balance sheet for both years, stating each asset as a percent of total assets and
each liability and stockholders' equity item as a percent of the total liabilities and stockholders' equity. If
required, round percentages to one decimal place.
Alvaraz Company
Comparative Balance Sheet
For the Years Ended December 31
Previous year
Previous year
Current year
Percent
Current year
Amount
Amount
Percent
Current assets
$300,630
$170,750
Property, plant, and equipment
510,160
478,100
100,210
34,150
Intangible assets
Total assets
$911,000
$683,000
Current liabilities
$191,310
$116,110
Long-term liabilities
373,510
280,030
Common stock
81,990
75,130
Retained earnings
264,190
211,730
Total liabilities and stockholders'
$911,000
$683,000
equity
96
Expert Solution
This question has been solved!
Explore an expertly crafted, step-by-step solution for a thorough understanding of key concepts.

This is a popular solution!

Trending now
This is a popular solution!

Step by step
Solved in 2 steps

Recommended textbooks for you
Managerial Accounting
Accounting
ISBN:
9781337912020
Author:
Carl Warren, Ph.d. Cma William B. Tayler
Publisher:
South-Western College Pub

Financial And Managerial Accounting
Accounting
ISBN:
9781337902663
Author:
WARREN, Carl S.
Publisher:
Cengage Learning,

Financial Accounting
Accounting
ISBN:
9781337272124
Author:
Carl Warren, James M. Reeve, Jonathan Duchac
Publisher:
Cengage Learning
Managerial Accounting
Accounting
ISBN:
9781337912020
Author:
Carl Warren, Ph.d. Cma William B. Tayler
Publisher:
South-Western College Pub
Financial And Managerial Accounting
Accounting
ISBN:
9781337902663
Author:
WARREN, Carl S.
Publisher:
Cengage Learning,
Financial Accounting
Accounting
ISBN:
9781337272124
Author:
Carl Warren, James M. Reeve, Jonathan Duchac
Publisher:
Cengage Learning

College Accounting, Chapters 1-27
Accounting
ISBN:
9781337794756
Author:
HEINTZ, James A.
Publisher:
Cengage Learning,

EBK CONTEMPORARY FINANCIAL MANAGEMENT
Finance
ISBN:
9781337514835
Author:
MOYER
Publisher:
CENGAGE LEARNING - CONSIGNMENT
