| Tickers WMT KO PFE CVS BRK.A # Assets WMT ко PFE CVS BRK.A WMT Ko 5 PFE CVS Allocation Percentage Name Individual Portfolio Assets 20.00% Walmart Inc 10.00% Coca-Cola Co 5.00% Pfizer Inc. 25.00% CVS Health Corp 40.00% Berkshire Hathaway Inc. Class A Portfolio Calculations (Annualized) Expected Returns Allocation 100.00% WMT 1.000 0.240 0.085 0.348 0.318 Portfolio Coorelation Matrix 7.32% WMT 0.027 0.007 0.004 0.014 КО 0.240 0.985 0.140 0.350 0.567 StdDev (Volatility o) 13.74% Portfolio Annualized Covariance Matrix КО 0.007 0.028 0.006 0.014 PFE 0.085 0.140 0.968 0.198 0.168 PFE 0.004 0.006 0.068 0.013 Allocation (w) 0.20 0.10 0.05 0.25 0.40 Sharpe Ratio 0.58 CVS 0.348 0.350 0.198 0.999 0.457 CVS 0.014 0.014 0.013 0.059 Mean Returns (μ) 6.24% 4.06% 0.33% 7.33% 9.53% BRK.A 0.318 0.567 0.168 0.457 0.994 BRK.A 0.009 0.016 0.007 0.018 Annualized StdDev (Volatility o) 15.65% 14.89% 15.33% 24.75% 16.05% Sharpe Ratio 0.44 0.31 0.06 0.32 0.63
| Tickers WMT KO PFE CVS BRK.A # Assets WMT ко PFE CVS BRK.A WMT Ko 5 PFE CVS Allocation Percentage Name Individual Portfolio Assets 20.00% Walmart Inc 10.00% Coca-Cola Co 5.00% Pfizer Inc. 25.00% CVS Health Corp 40.00% Berkshire Hathaway Inc. Class A Portfolio Calculations (Annualized) Expected Returns Allocation 100.00% WMT 1.000 0.240 0.085 0.348 0.318 Portfolio Coorelation Matrix 7.32% WMT 0.027 0.007 0.004 0.014 КО 0.240 0.985 0.140 0.350 0.567 StdDev (Volatility o) 13.74% Portfolio Annualized Covariance Matrix КО 0.007 0.028 0.006 0.014 PFE 0.085 0.140 0.968 0.198 0.168 PFE 0.004 0.006 0.068 0.013 Allocation (w) 0.20 0.10 0.05 0.25 0.40 Sharpe Ratio 0.58 CVS 0.348 0.350 0.198 0.999 0.457 CVS 0.014 0.014 0.013 0.059 Mean Returns (μ) 6.24% 4.06% 0.33% 7.33% 9.53% BRK.A 0.318 0.567 0.168 0.457 0.994 BRK.A 0.009 0.016 0.007 0.018 Annualized StdDev (Volatility o) 15.65% 14.89% 15.33% 24.75% 16.05% Sharpe Ratio 0.44 0.31 0.06 0.32 0.63

Survey of Accounting (Accounting I)
8th Edition
ISBN:9781305961883
Author:Carl Warren
Publisher:Carl Warren
Chapter15: Capital Investment Analysis
Section: Chapter Questions
Problem 15.5.2MBA: Financial leverage Costco Wholesale Corporation (COST) and Wel-Mart Stroes Inc. (WMT)reported the...

Related questions
Question
I've a set of 5 securities and their individual and portfolio SD/Mean etc. i had to choose random weightings for them but then have a question around minimizing CV.
How do i find and graph of the distribution of the return of the portfolio?
(what i have so far attached for reference - but just wondering what formula/concept i use to do so)
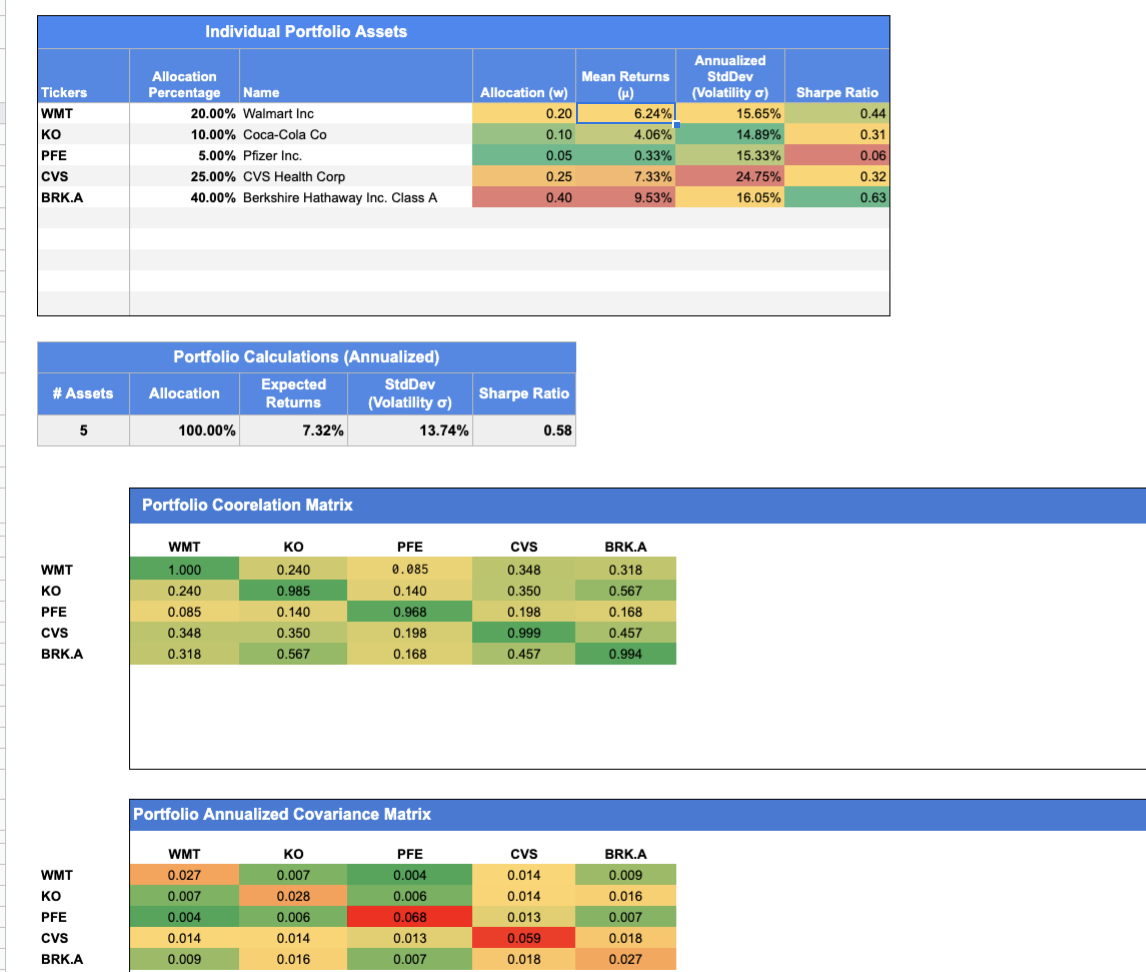
Transcribed Image Text:Individual Portfolio Assets
Annualized
Allocation
Mean Returns
StdDev
Sharpe Ratio
0.44
Tickers
Percentage
Name
Allocation (w)
(Volatility a)
(H)
6.24%
WMT
20.00% Walmart Inc
0.20
15.65%
KO
10.00% Coca-Cola Co
0.10
4.06%
14.89%
0.31
PFE
5.00% Pfizer Inc.
0.05
0.33%
15.33%
0.06
cvs
25.00% CVS Health Corp
0.25
7.33%
24.75%
0.32
BRK.A
40.00% Berkshire Hathaway Inc. Class A
0.40
9.53%
16.05%
0.63
Portfolio Calculations (Annualized)
Expected
StdDev
# Assets
Allocation
Sharpe Ratio
Returns
(Volatility o)
100.00%
7.32%
13.74%
0.58
Portfolio Coorelation Matrix
WMT
ко
PFE
CVs
BRK.A
WMT
1.000
0.240
0.085
0,348
0.318
ко
0.240
0.985
0.140
0.350
0.567
PFE
0.085
0.140
0.968
0.198
0.168
CVs
0.348
0.350
0.198
0.999
0.457
BRK.A
0.318
0.567
0.168
0.457
0.994
Portfolio Annualized Covariance Matrix
WMT
ко
PFE
CVs
BRK.A
WMT
0.027
0.007
0.004
0.014
0.009
ко
0.007
0.028
0.006
0.014
0.016
PFE
0.004
0.006
0.068
0.013
0.007
CVs
0.014
0.014
0.013
0.059
0.018
BRK.A
0.009
0.016
0.007
0.018
0.027
Expert Solution
This question has been solved!
Explore an expertly crafted, step-by-step solution for a thorough understanding of key concepts.

Step by step
Solved in 4 steps with 1 images

Knowledge Booster


Learn more about
Need a deep-dive on the concept behind this application? Look no further. Learn more about this topic, finance and related others by exploring similar questions and additional content below.Recommended textbooks for you
Survey of Accounting (Accounting I)
Accounting
ISBN:
9781305961883
Author:
Carl Warren
Publisher:
Cengage Learning


Cornerstones of Financial Accounting
Accounting
ISBN:
9781337690881
Author:
Jay Rich, Jeff Jones
Publisher:
Cengage Learning
Survey of Accounting (Accounting I)
Accounting
ISBN:
9781305961883
Author:
Carl Warren
Publisher:
Cengage Learning
Cornerstones of Financial Accounting
Accounting
ISBN:
9781337690881
Author:
Jay Rich, Jeff Jones
Publisher:
Cengage Learning

Fundamentals of Financial Management (MindTap Cou…
Finance
ISBN:
9781285867977
Author:
Eugene F. Brigham, Joel F. Houston
Publisher:
Cengage Learning