4. For fiscal 2020: Free Cash Flow to Equity

Financial Accounting: The Impact on Decision Makers
10th Edition
ISBN:9781305654174
Author:Gary A. Porter, Curtis L. Norton
Publisher:Gary A. Porter, Curtis L. Norton
Chapter9: Current Liabilities, Contingencies, And The Time Value Of Money
Section: Chapter Questions
Problem 9.2AP

Related questions
Question
Please use the attached images as well...
Compute the following:
4. For fiscal 2020:
5. Market Capitalization, Market to Book Value and the Price-Earnings Ratio as of year-end 2020
Stock Prices in 2018 = $68.98
2019 = $84.15
2020 = $107.82
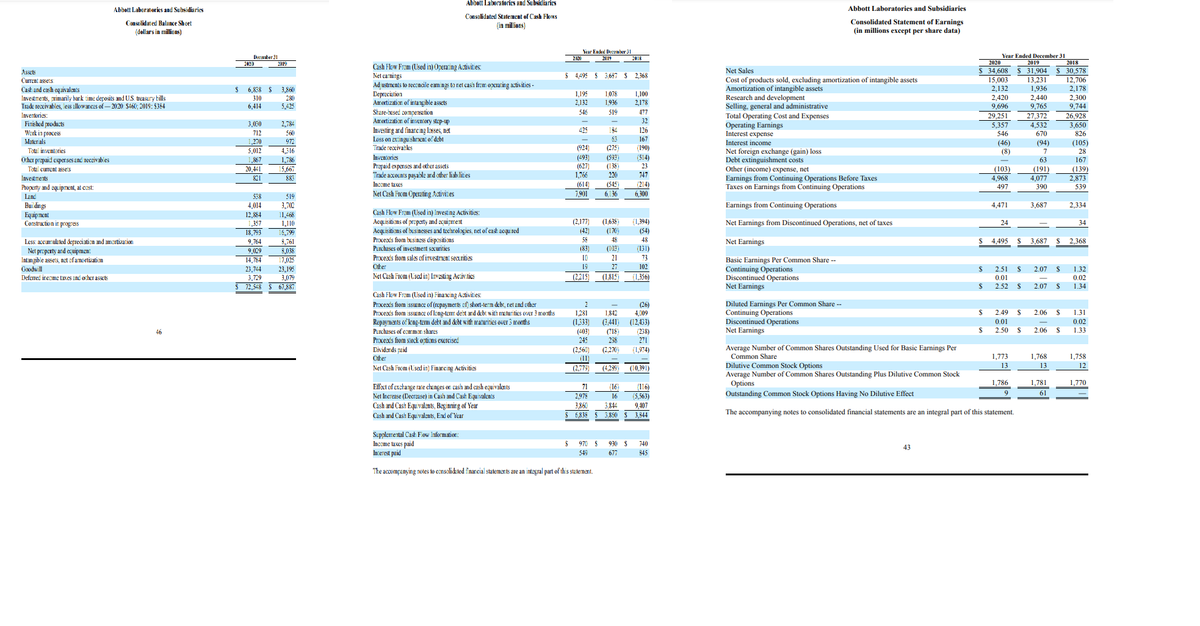
Transcribed Image Text:Abbott Laboratories and Subsidiaries
Abbott Laboratories and Subsidiaries
Abbott Laboratories and Subsidiaries
Consolidated Statement of Cash Flows
(in millions)
Consolidated Statement of Earnings
(in millions except per share data)
Consolidat ed Balance Sheet
(dellars in millions)
Year Ended December 31
Deceraber 31
2120
2019
Year Ended December 31
2020
2018
30,578
12,706
2,178
2.300
9,744
2019
Cash Flow From (Used in) Operating Activities:
Net earnings
Ad ustments to reccncile eamings to net cash from operating activities -
Depreciation
Amortization of intangible assets
Stare-based compensation
Amortization of inventory step-up
Assets
Net Sales
34,608
31,904
$ 4495 $ 3,687 $ 2,368
Cost of products sold, excluding amortization of intangible assets
Amortization of intangible assets
Research and development
Selling, general and administrative
Total Operating Cost and Expenses
Operating Earnings
Interest expense
15,003
2,132
2,420
9,696
29,251
5,357
13,231
1,936
2,440
9,765
Current assets
Cash and cash equivalents
Investments, rimarily bark time deposits and US. treasury bills
Trade receivables, less allowances of- 2020 $460; 2019: $364
Inventories:
Finished products
Werk in process
Materials
Total inventories
6,838 $
3,860
1,195
2,132
1,078
1,100
310
280
1,936
2,178
6,414
5,425
546
519
477
27,372
4,532
26,928
3,650
32
3,050
2,784
Investing ard financing loses, net
Loss on extinguishrment of debt
Trade receivables
Invemtories
Prepaid ex penses and other assets
Trade accounts payable and other liablities
425
184
126
712
560
546
670
826
53
167
1,270
972
Interest income
Net foreign exchange (gain) loss
Debt extinguishment costs
Other (income) expense, net
Earnings from Continuing Operations Before Taxes
Taxes on Earnings from Continuing Operations
(46)
(8)
(94)
(105)
28
5,012
4316
(924)
(275)
(190)
7
(493)
(627
1,766
(593)
(138)
20
Ocher prapaid experses and reczivabies
,867
(514)
167
1,786
15,667
63
23
(103)
(139)
2,873
Total current assets
20,441
(191)
4,077
747
Investments
821
883
4,968
Income taxes
(614)
7,901
(545)
(214)
Property and equipment, at cast:
497
390
539
Lad
538
519
Net Cash From Operating Activities
6,136
6,300
Bui dings
Equipment
Construction ir progress
4,014
Earnings from Continuing Operations
2,334
3,702
11,468
1,110
4,471
3,687
Cash Flow From (Used in) Investing Activities:
12,884
Acquisitions of property and aquipment
Acquisitions of businesses and technologies, net of cash acqui red
Proceads from business dispasitions
Purchases of investnment sacurities
(2,177)
(42)
(1,638)
(170)
(1,394)
Net Earnings from Discontinued Operations, net of taxes
24
34
1,357
18,793
9,764
(54)
15,799
8,761
58
48
48
Net Earnings
%24
24
Less: accurulated depreciation and amortization
Net property and ecuipmen:
Intangible assets,
Goodwill
4,495
3,687
2,368
9,029
(83)
(103)
(131)
8,038
17,025
23,195
3,079
$ 67,887
Proceads from salas of investment securities
Other
Net Cash From (Lsed in) Invasting Acivities
of amortization
14.784
21
73
Basic Earnings Per Common Share -
Continuing Operations
Discontinued Operations
Net Earnings
19
27
102
23,744
2$
2.51 $
2.07
$
1.32
Deferred income taxes and ocher assets
(2215)
(1,815
(1,356)
3,729
72,548
0.01
0.02
2.52 $
2.07 $
1.34
Cash Flow From (Used in) Financing Activities:
Proceads fiom issuance of (repayments of) short-tern debt, ret and other
Proceads from issuance of leng-term dest and debt with meturities over 3 months
Repayments of kng-term debt and debt with maturities over 3 m:Ornths
Purchases of common shares
Proceads from stock ontions exercised
Diluted Earnings Per Common Share --
Continuing Operations
Discontinued Operations
Net Earnings
(26)
4,009
1281
1,842
2$
2.49
%24
2.06
2$
1.31
(1,333)
(403)
(3,441)
(718
298
(12,433)
0.01
0.02
46
(238)
2$
2.50
$
2.06
1.33
245
271
Average Number of Common Shares Outstanding Used for Basic Earnings Per
Common Share
(2,560
Dividards paid
Cther
(2,270
(1,974)
()
1,773
1,768
1,758
Dilutive Common Stock Options
Average Number of Common Shares Outstanding Plus Dilutive Common Stock
Options
Outstanding Common Stock Options Having No Dilutive Effect
13
13
12
Net Cash From (Used in) Financing Activities
(2,775
(4,289
(10,391)
Effect of exchange rate chɛnges or cash and cash equivalents
1,786
1,781
1,770
71
(16)
(116)
2,978
16
61
Net Increase (Decrease) in Cash and Cash Equivalents
Cash and Cash Equivalents, Beginnirg of Year
Cash and Cash Equivalents, End of Year
(5,563)
3.860
9,407
3.850 $ 3,844
3,844
The accompanying notes to consolidated financial statements are an integral part of this statement.
6,838
Supplemental Cash Flow Information:
Imcome tases paid
970 S
930 $
740
43
In:erest paid
5459
677
845
The accompanying notes to cansalidated finarcial statements are an integral part of this statement.
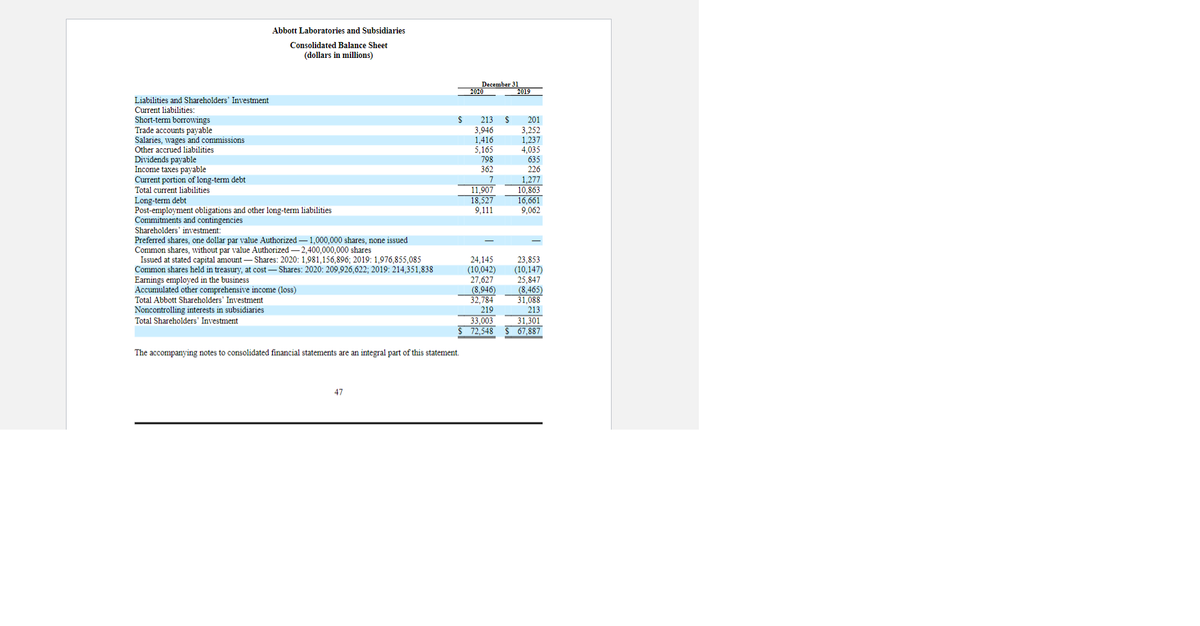
Transcribed Image Text:Abbott Laboratories and Subsidiaries
Consolidated Balance Sheet
(dollars in millions)
December 31
2020
2019
Liabilities and Shareholders' Investment
Current liabilities:
Short-term borrowings
Trade accounts payable
Salaries,
213
201
3.946
1,416
5,165
798
362
3,252
1,237
4,035
635
wages and commissions
Other accrued liabilities
Dividends payable
Income taxes payable
Current portion of long-term debt
Total current liabilities
11,907
18,527
9,111
1,277
10,863
16,661
9,062
Long-term debt
Post-employment obligations and other long-term liabilities
Commitments and contingencies
Shareholders' investment:
Preferred shares, one dollar par value Authorized – 1,000,000 shares, none issued
Common shares, without par value Authorized – 2,400,000,000 shares
Issued
Common shares held in treasury, at cost – Shares: 2020: 209,926,622; 2019: 214,351,838
Earnings employed in the business
Accumulated other comprehensive income (loss)
Total Abbott Shareholders' Investment
stated capital amount– Shares: 2020: 1,981,156,896; 2019: 1,976,855,085
23,853
(10,147)
25,847
(8,465)
31,088
213
at
24,145
(10,042)
27,627
(8,946)
32.784
Noncontrolling interests in subsidiaries
Total Shareholders' Investment
219
33.003
72,548
31,301
$ 67,887
The accompanying notes to consolidated financial statements are an integral part of this statement.
47
Expert Solution
This question has been solved!
Explore an expertly crafted, step-by-step solution for a thorough understanding of key concepts.

This is a popular solution!

Trending now
This is a popular solution!

Step by step
Solved in 2 steps

Recommended textbooks for you
Financial Accounting: The Impact on Decision Make…
Accounting
ISBN:
9781305654174
Author:
Gary A. Porter, Curtis L. Norton
Publisher:
Cengage Learning

Managerial Accounting
Accounting
ISBN:
9781337912020
Author:
Carl Warren, Ph.d. Cma William B. Tayler
Publisher:
South-Western College Pub

Intermediate Accounting: Reporting And Analysis
Accounting
ISBN:
9781337788281
Author:
James M. Wahlen, Jefferson P. Jones, Donald Pagach
Publisher:
Cengage Learning
Financial Accounting: The Impact on Decision Make…
Accounting
ISBN:
9781305654174
Author:
Gary A. Porter, Curtis L. Norton
Publisher:
Cengage Learning
Managerial Accounting
Accounting
ISBN:
9781337912020
Author:
Carl Warren, Ph.d. Cma William B. Tayler
Publisher:
South-Western College Pub
Intermediate Accounting: Reporting And Analysis
Accounting
ISBN:
9781337788281
Author:
James M. Wahlen, Jefferson P. Jones, Donald Pagach
Publisher:
Cengage Learning

College Accounting, Chapters 1-27
Accounting
ISBN:
9781337794756
Author:
HEINTZ, James A.
Publisher:
Cengage Learning,


Cornerstones of Financial Accounting
Accounting
ISBN:
9781337690881
Author:
Jay Rich, Jeff Jones
Publisher:
Cengage Learning