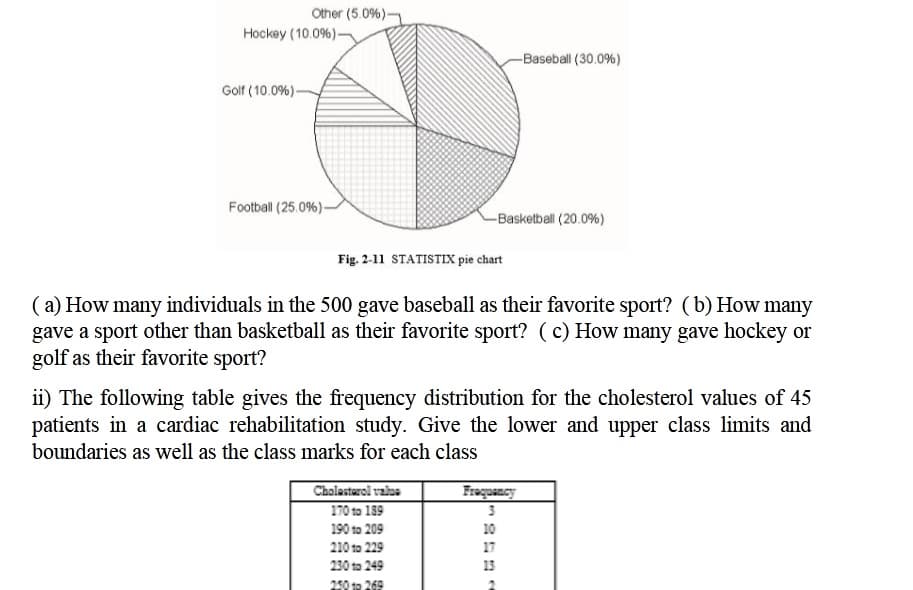
Other (5.0%) Hockey (10.0%)- -Baseball (30.0%) Golf (10.0%)- Football (25.0%)- -Basketball (20.0%) Fig. 2-11 STATISTIX pie chart (a) How many individuals in the 500 gave baseball as their favorite sport? (b) How many gave a sport other than basketball as their favorite sport? ( c) How many gave hockey or golf as their favorite sport?

Holt Mcdougal Larson Pre-algebra: Student Edition 2012
1st Edition
ISBN:9780547587776
Author:HOLT MCDOUGAL
Publisher:HOLT MCDOUGAL
Chapter11: Data Analysis And Probability
Section11.4: Collecting Data
Problem 6E
icon
Related questions
icon
Concept explainers
Question
Other (5.0%)-
Hockey (10.0%)-
-Baseball (30.0%)
Golf (10.0%)-
Football (25.0%)-
-Basketball (20.0%)
Fig. 2-11 STATISTIX pie chart
(a) How many individuals in the 500 gave baseball as their favorite sport? (b) How many
gave a sport other than basketball as their favorite sport? (c) How many gave hockey or
golf as their favorite sport?
ii) The following table gives the frequency distribution for the cholesterol values of 45
patients in a cardiac rehabilitation study. Give the lower and upper class limits and
boundaries as well as the class marks for each class
Cholestarol valae
170 to 189
Fraquancy
190 to 209
10
210 to 229
17
230 to 249
13
250 ta 269
Transcribed Image Text:Other (5.0%)- Hockey (10.0%)- -Baseball (30.0%) Golf (10.0%)- Football (25.0%)- -Basketball (20.0%) Fig. 2-11 STATISTIX pie chart (a) How many individuals in the 500 gave baseball as their favorite sport? (b) How many gave a sport other than basketball as their favorite sport? (c) How many gave hockey or golf as their favorite sport? ii) The following table gives the frequency distribution for the cholesterol values of 45 patients in a cardiac rehabilitation study. Give the lower and upper class limits and boundaries as well as the class marks for each class Cholestarol valae 170 to 189 Fraquancy 190 to 209 10 210 to 229 17 230 to 249 13 250 ta 269
Q3 i): A survey of 500 randomly chosen individuals is conducted. The individuals are
asked to name their favorite sport. The STATISTIX pie chart in the following figure
summarizes the results of this survey
Transcribed Image Text:Q3 i): A survey of 500 randomly chosen individuals is conducted. The individuals are asked to name their favorite sport. The STATISTIX pie chart in the following figure summarizes the results of this survey
Expert Solution
steps

Step by step

Solved in 4 steps

Blurred answer
Knowledge Booster
Correlation, Regression, and Association
Learn more about
Need a deep-dive on the concept behind this application? Look no further. Learn more about this topic, statistics and related others by exploring similar questions and additional content below.
Recommended textbooks for you
Holt Mcdougal Larson Pre-algebra: Student Edition…
Algebra
ISBN:
9780547587776
Author:
HOLT MCDOUGAL
Publisher:
HOLT MCDOUGAL
Glencoe Algebra 1, Student Edition, 9780079039897…
Algebra
ISBN:
9780079039897
Author:
Carter
Publisher:
McGraw Hill
Big Ideas Math A Bridge To Success Algebra 1: Stu…
Algebra
ISBN:
9781680331141
Author:
HOUGHTON MIFFLIN HARCOURT
Publisher:
Houghton Mifflin Harcourt
College Algebra (MindTap Course List)
Algebra
ISBN:
9781305652231
Author:
R. David Gustafson, Jeff Hughes
Publisher:
Cengage Learning
College Algebra
College Algebra
Algebra
ISBN:
9781938168383
Author:
Jay Abramson
Publisher:
OpenStax