ould have the right to marry. (The 2014 data were collected before the 2015 US upreme Court decision granting same-sex couples the right to marry.) Responses easured on a 5-point scale from strongly agree (1) to strongly disagree (5). Cumulati Percentag Homosexuals Should Have Right to Marry (2014) Frequency Percentage Strongly agree 251 32.5 32.5 Agree 195 25.2 57.5
ould have the right to marry. (The 2014 data were collected before the 2015 US upreme Court decision granting same-sex couples the right to marry.) Responses easured on a 5-point scale from strongly agree (1) to strongly disagree (5). Cumulati Percentag Homosexuals Should Have Right to Marry (2014) Frequency Percentage Strongly agree 251 32.5 32.5 Agree 195 25.2 57.5

Glencoe Algebra 1, Student Edition, 9780079039897, 0079039898, 2018
18th Edition
ISBN:9780079039897
Author:Carter
Publisher:Carter
Chapter10: Statistics
Section10.6: Summarizing Categorical Data
Problem 23PPS

Related questions
Question
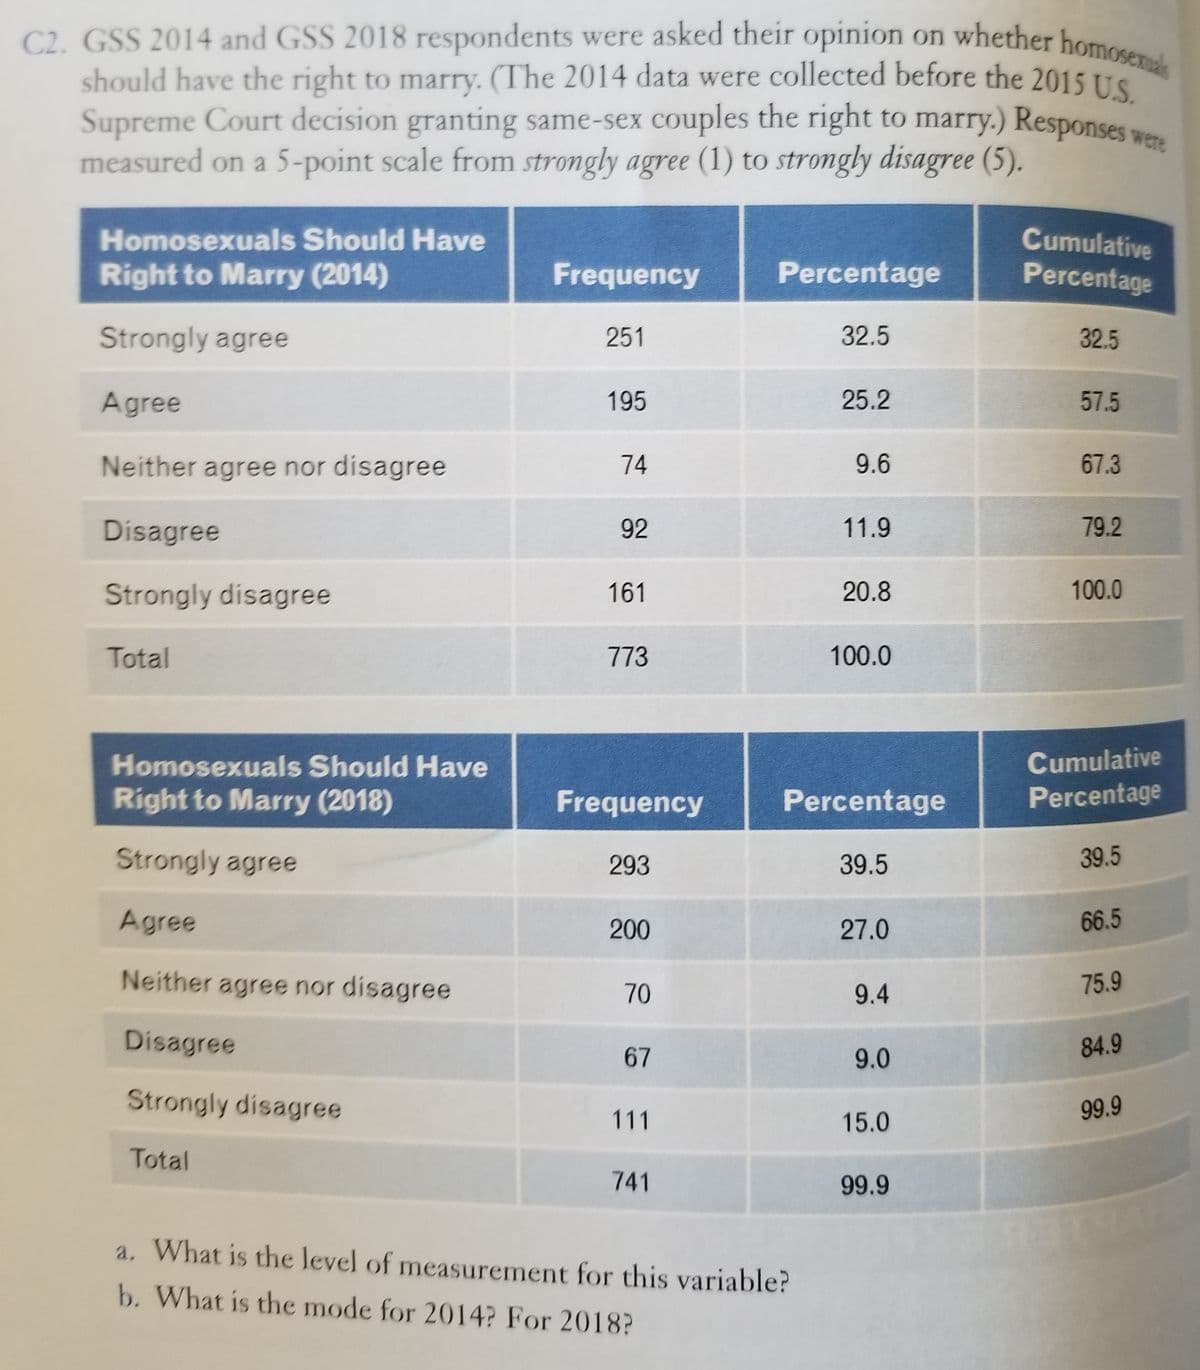
Transcribed Image Text:C2. GSS 2014 and GSS 2018 respondents were asked their opinion on whether homosexuals
should have the right to marry. (The 2014 data were collected before the 2015 US
Supreme Court decision granting same-sex couples the right to marry.) Responses
measured on a 5-point scale from strongly agree (1) to strongly disagree (5).
Cumulative
Percentage
Homosexuals Should Have
Right to Marry (2014)
Frequency
Percentage
Strongly agree
251
32.5
32.5
Agree
195
25.2
57.5
Neither agree nor disagree
74
9.6
67.3
Disagree
92
11.9
79.2
Strongly disagree
161
20.8
100.0
Total
773
100.0
Homosexuals Should Have
Cumulative
Right to Marry (2018)
Frequency
Percentage
Percentage
Strongly agree
293
39.5
39.5
Agree
200
27.0
66.5
Neither agree nor disagree
70
9.4
75.9
Disagree
84.9
67
9.0
Strongly disagree
99.9
111
15.0
Total
741
99.9
a, What is the level of measurement for this variable?
b. What is the mode for 2014? For 2018?
Transcribed Image Text:c. Calculate the median for this variable. In general, how would you characterize the
public's attitude about same-sex marriage? Is there a difference in attitudes between
the 2 years?
Expert Solution
This question has been solved!
Explore an expertly crafted, step-by-step solution for a thorough understanding of key concepts.

Step by step
Solved in 4 steps

Recommended textbooks for you
Glencoe Algebra 1, Student Edition, 9780079039897…
Algebra
ISBN:
9780079039897
Author:
Carter
Publisher:
McGraw Hill
Glencoe Algebra 1, Student Edition, 9780079039897…
Algebra
ISBN:
9780079039897
Author:
Carter
Publisher:
McGraw Hill