Find the 55 th percentile for the data shown using the interpolation method (Definition 3) 1.6 2.3 5.2 5.4 12.9 15.4 16.4 16.9 21.7 21.9 24.2 25.3 28.6 29.6
Find the 55 th percentile for the data shown using the interpolation method (Definition 3) 1.6 2.3 5.2 5.4 12.9 15.4 16.4 16.9 21.7 21.9 24.2 25.3 28.6 29.6

Glencoe Algebra 1, Student Edition, 9780079039897, 0079039898, 2018
18th Edition
ISBN:9780079039897
Author:Carter
Publisher:Carter
Chapter10: Statistics
Section10.5: Comparing Sets Of Data
Problem 1GP

Related questions
Question
Mm7
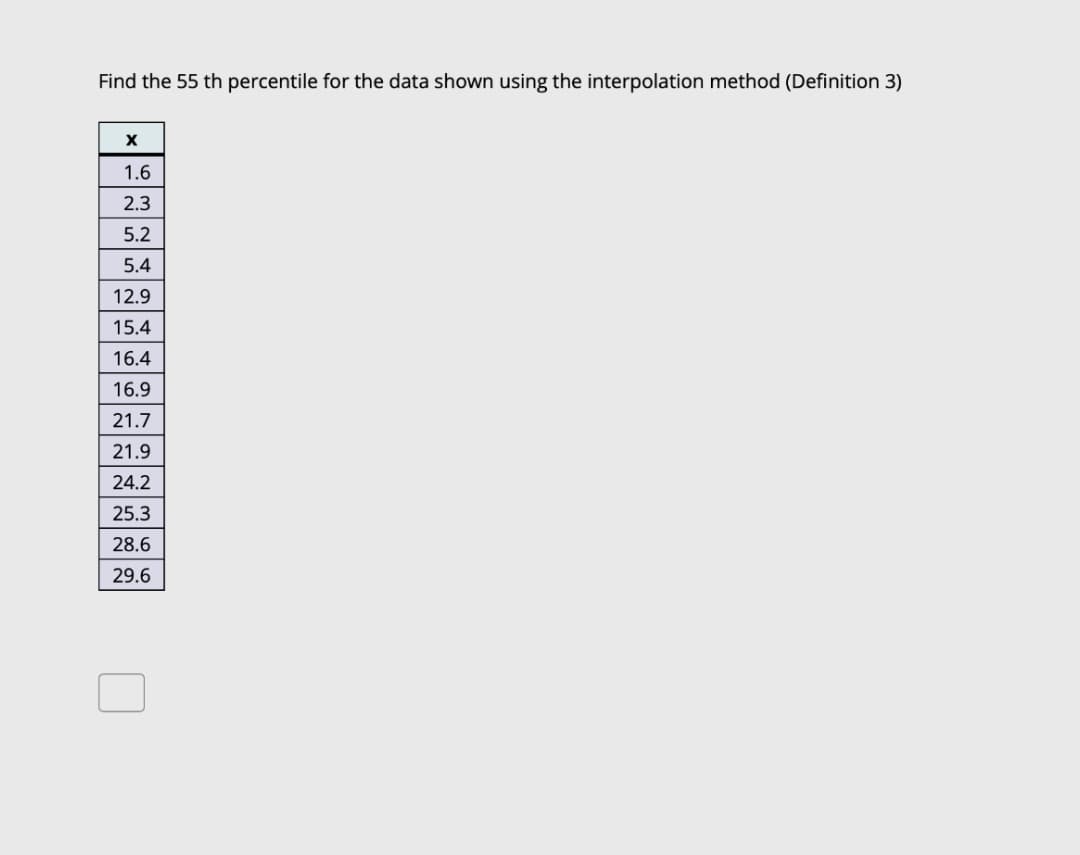
Transcribed Image Text:Find the 55 th percentile for the data shown using the interpolation method (Definition 3)
1.6
2.3
5.2
5.4
12.9
15.4
16.4
16.9
21.7
21.9
24.2
25.3
28.6
29.6
Expert Solution
This question has been solved!
Explore an expertly crafted, step-by-step solution for a thorough understanding of key concepts.

This is a popular solution!

Trending now
This is a popular solution!

Step by step
Solved in 2 steps with 2 images

Recommended textbooks for you
Glencoe Algebra 1, Student Edition, 9780079039897…
Algebra
ISBN:
9780079039897
Author:
Carter
Publisher:
McGraw Hill
Glencoe Algebra 1, Student Edition, 9780079039897…
Algebra
ISBN:
9780079039897
Author:
Carter
Publisher:
McGraw Hill