ouseholds are randomly selected and partitioned into groups of four. For those groups, the random variable x is the number of households with a printer. Determine whether a probability distribution is given. If a probability stribution is given, find its mean and standard deviation. If a probability distribution is not given, identify the requirements that are not satisfied. oes the table show a probability distribution? Select all that apply. A. Yes, the table shows a probability distribution. B. No, not every probability is between 0 and 1 inclusive. C. No, the numerical values of the random variable x are not associated with probabilities. D. No, the sum of all the probabilities is not equal to 1. x | P(X) 0 0.023 1 0.146 2 0.341 3 0.354 4 0.136
ouseholds are randomly selected and partitioned into groups of four. For those groups, the random variable x is the number of households with a printer. Determine whether a probability distribution is given. If a probability stribution is given, find its mean and standard deviation. If a probability distribution is not given, identify the requirements that are not satisfied. oes the table show a probability distribution? Select all that apply. A. Yes, the table shows a probability distribution. B. No, not every probability is between 0 and 1 inclusive. C. No, the numerical values of the random variable x are not associated with probabilities. D. No, the sum of all the probabilities is not equal to 1. x | P(X) 0 0.023 1 0.146 2 0.341 3 0.354 4 0.136

MATLAB: An Introduction with Applications
6th Edition
ISBN:9781119256830
Author:Amos Gilat
Publisher:Amos Gilat
Chapter1: Starting With Matlab
Section: Chapter Questions
Problem 1P

Related questions
Question
100%
need help
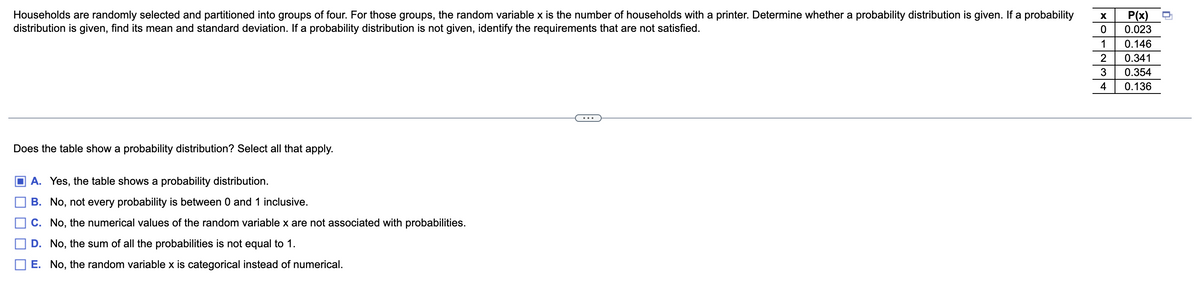
Transcribed Image Text:Households are randomly selected and partitioned into groups of four. For those groups, the random variable x is the number of households with a printer. Determine whether a probability distribution is given. If a probability
distribution is given, find its mean and standard deviation. If a probability distribution is not given, identify the requirements that are not satisfied.
Does the table show a probability distribution? Select all that apply.
A. Yes, the table shows a probability distribution.
B. No, not every probability is between 0 and 1 inclusive.
C. No, the numerical values of the random variable x are not associated with probabilities.
D. No, the sum of all the probabilities is not equal to 1.
E. No, the random variable x is categorical instead of numerical.
X P(x)
0 0.023
1 0.146
2
0.341
3
0.354
4
0.136
n
Expert Solution
This question has been solved!
Explore an expertly crafted, step-by-step solution for a thorough understanding of key concepts.

This is a popular solution!

Trending now
This is a popular solution!

Step by step
Solved in 3 steps with 1 images

Recommended textbooks for you
MATLAB: An Introduction with Applications
Statistics
ISBN:
9781119256830
Author:
Amos Gilat
Publisher:
John Wiley & Sons Inc

Probability and Statistics for Engineering and th…
Statistics
ISBN:
9781305251809
Author:
Jay L. Devore
Publisher:
Cengage Learning

Statistics for The Behavioral Sciences (MindTap C…
Statistics
ISBN:
9781305504912
Author:
Frederick J Gravetter, Larry B. Wallnau
Publisher:
Cengage Learning
MATLAB: An Introduction with Applications
Statistics
ISBN:
9781119256830
Author:
Amos Gilat
Publisher:
John Wiley & Sons Inc
Probability and Statistics for Engineering and th…
Statistics
ISBN:
9781305251809
Author:
Jay L. Devore
Publisher:
Cengage Learning
Statistics for The Behavioral Sciences (MindTap C…
Statistics
ISBN:
9781305504912
Author:
Frederick J Gravetter, Larry B. Wallnau
Publisher:
Cengage Learning

Elementary Statistics: Picturing the World (7th E…
Statistics
ISBN:
9780134683416
Author:
Ron Larson, Betsy Farber
Publisher:
PEARSON

The Basic Practice of Statistics
Statistics
ISBN:
9781319042578
Author:
David S. Moore, William I. Notz, Michael A. Fligner
Publisher:
W. H. Freeman

Introduction to the Practice of Statistics
Statistics
ISBN:
9781319013387
Author:
David S. Moore, George P. McCabe, Bruce A. Craig
Publisher:
W. H. Freeman