Over the past 40 years interest rates in the developed world have fallen to very low levels. One argument for this is rising income inequality which has led to imbalances in savings and insufficient aggregate demand. Take the following Keynesian consumption functions for the "poor" (P) and “rich" (R) as given c = C+c°y°, (1) CR = Č +CRYR. (2) Suppose that C is the same for both poor and rich. Further suppose that c > c and define aggregate demand as the sum of CP and CR. Based on the above, could a rise in income inequality explain "insufficient demand"? Ex- plain.
Q: Consider the households in the US that held sub-prime mortgages before/during the financial crisis.…
A: The meaning of subprime mortgages are provided to the borrowers with low credit rating or high…
Q: Last year, Jim and Matthew both spent about two third of their income on consumption. This year,…
A: We’ll answer the first question since the exact one wasn’t specified. Please submit a new question…
Q: 19 In this consumption function C= C0 + C1*Yd equation; C0 Known as Select one: a. Autonomous…
A: Autonomous consumption: It is the consumption expenditure that the consumers do when they have zero…
Q: The chart below gives the data necessary to make a Keynesian cross diagram. Assume that the tax rate…
A: Likewise to GDP, aggregate expenditure assesses the complete expenditure of a country at a given…
Q: The figure below shows a simple macroeconomic consumption model. The letters N and D indicate…
A: The term "savings function" refers to the standard equation of savings that defines the relationship…
Q: If an economy is to the left of the equilibrium level of GDP on the Keynesian cross diagram, then…
A: In the Keynesian model, the aggregate expenditures in the economy can be determined using the…
Q: Calculate the missing values in the table below given that the Aggregate Consumption Function for a…
A: The following problem has been solved as follows:
Q: The consumption and saving functions in the Keynesian model Suppose we observe that a person's…
A: As there are multiple parts to the problem, 1st three parts would be solved. The following Keynesian…
Q: Two identical countries, Country A and Country B, can each be described by a Keynesian-cross model.…
A: Government spending multiplier = 1 / (1 - MPC) Tax multiplier = MPC / (1-MPC)
Q: Following data is given for two country Keynesian model with no government (G=T=0) C= 100+0.9Y I=…
A: The Macroeconomic policy allows the economy to be looked at and the components estimated to be in…
Q: One of the following is not assumption of the Keynesians explanation for income determination in a…
A: Macroeconomics is a part of economics that deals with production, decision and allocation concerning…
Q: The graph represents consumption (C) as a function of disposable income (DI). Assume the consumption…
A: We have: DI represents disposable income C represents consumption. ------------------- According to…
Q: Assume in country Y, the average marginal propensity to save is 0.2. When the aggregate income is…
A: Marginal Propensity to Save (MPS) is the amount of money an individual saves while disposable income…
Q: Assume a hypothetical closed economy. The National income identity expression for this economy is…
A: National income refers to the total money income earned by the citizens of a country in a particular…
Q: Y= AD on 45-degree line AD A C, + I(r) + G +X Note: AD = c, + c,(1 – t)Y + I(r) + G + X-mY 45°…
A: The equilibrium condition in an economy represents the situation where the optimum output is…
Q: Explain the relationship between consumption and saving in the Keynesian model.
A: The total expenditure within the economy and its consequences on output, employment, and inflation…
Q: In the IS curve model, the consumer demand can be represented by the following equation: C = a +…
A: The consumption function : C = a + b(Y-T) Here a is the intercept that indicates the level of…
Q: The consumption and saving functions in the Keynesian model Suppose we observe that a person's…
A: We are going to calculate savings in year 2021 to answer the part f.
Q: Which of the following is correct? When the consumption function lies above the 45-degree line,…
A: Consumption function shows the relationship between the consumption and the disposable income. The…
Q: Suppose the consumption of an economy is given by C = 20 +0.6Y The following investment function is…
A:
Q: 1. Over the past 40 years interest rates in the developed world have fallen to very low levels. One…
A: Income inequality refers to the unequal distribution of income among all the sectors of the country…
Q: Carefully explain the major differences between the Keynes’ and Fisher’s models of consumption.
A: The consumption function, often known as the Keynesian consumption function, is an economic formula…
Q: With a help of a diagram discuss how the permanent income theory of consumption explains the…
A: The Permanent Income Hypothesis, abbreviated PIH, is an economic theory that seeks to explain how…
Q: Consider two closed economies that are identical except for their marginal propensity to consume…
A: Given information: There are two economies - First economy has MPC = 0.5 and Second economy has MPC…
Q: The following are exogenous (not directly affected by income): G = 9 I = 14 X = M = 0 The…
A: We are authorized to answer one question at a time since you have not mentioned which question you…
Q: a. Copy and paste table above and fill in aggregate demand (AD). b. Derive the consumption function.
A: Since you have posted a question with multiple sub-parts, we will solve the first three sub-parts…
Q: Consider two closed economies that are identical except for their marginal propensity to consume…
A: An investment increases by $20billion, new AE line will shift upward parallely by $20billion.
Q: The consumption function macroeconomics is often written as C= a + b(Y-T) where b expresses: a.…
A: Meaning of Macroeconomics: The term macroeconomics refers to the situation of economic and…
Q: Keynesia: Government expenditure 400 Exports 250 Autonomous imports 50 Autonomous consumption…
A: "Since you have posted a question with multiple sub-parts, we will solve the first three subparts…
Q: Explain the Keynesian, saving-consumption relationship, and interpret consumption and saving…
A: Keynesian consumption function gives the functional relationship between household consumption and…
Q: One other factor that affects the Consumption and saving behavior is household Wealth (accumulated…
A: The equilibrium level of GDP (Y) is the level at which Y is equal to the sum of C and I. C is…
Q: The chart below gives the data necessary to make a Keynesian cross diagram. Assume that the tax rate…
A: National Income Ater tax Income Consumption I+G+X Minus Imports Aggregate Expenditure 100…
Q: Consider the Keynesian Cross model. An economy is characterized by the following conditions: •…
A: (A) Aggregate expenditure equation:AE = C + IP + G => AE = 200 + 0.75 (Y-T) + 200 + 100 => AE…
Q: In the Keynesian cross model, assume that the consumption function is given by C = $220 + 0.7(Y – T)…
A: d. The equilibrium level of income is given as Y=1080. Substitute the value in the function as…
Q: Q.1.15 Induced consumption is: (a) the part of consumption which is independent of the level of…
A: "Since you have asked multiple questions, we will solve the first question for you. If you want any…
Q: The consumption and saving functions in the Keynesian model Suppose we observe that a person's…
A: It is given that disposable income of 2019, 2020 is as follows In 2019 Yd=Y-T=50,000 In 2020,…
Q: Given the Marginal Propensity to Consume, Cʹ (Y) = 0.8 + 0.1 Y-1/2 And the…
A: The consumption function depicts the relationship between the consumption and the disposable income.…
Q: Suppose you know the following facts about consumer behavior of Amy in 2019. In a year, Amy…
A: The consumption function, often known as the Keynesian consumption function, is an economic formula…
Q: Consider a hypothetical economy in which the marginal propensity to consume (MPC) is 0.50. That is,…
A: Given information MPC=0.5 Consumption=350 Output=400
Q: Suppose that the government increases its spending by 50$. If the MPC (marginal propensity to…
A: In an economy, short run equilibrium level of output is determined at a level where aggregate demand…
Q: Suppose we have the following information for the simple (fixed r, fixed P, fixed W) Keynesian…
A: Equilibrium in the keynesian model is achieved at the point where income is equal to aggregate…
Q: Consider the impact of an increase in thriftiness in the Keynesian cross. Suppose the consumption…
A: The Keynesian equilibrium can also be represented by comparison of saving and investment function.…
Q: In the Keynesian cross, assume that the consumption function is given by C = 200 + 0.75 (Y − T).…
A:
Q: Explain what the consumption function shows, and describe what is held constant along the…
A: Since you have asked multiple questions, we will solve the first question for you. If you want any…
Pls answer fully with this question, and get tips with leaving ur e-mail on the paper
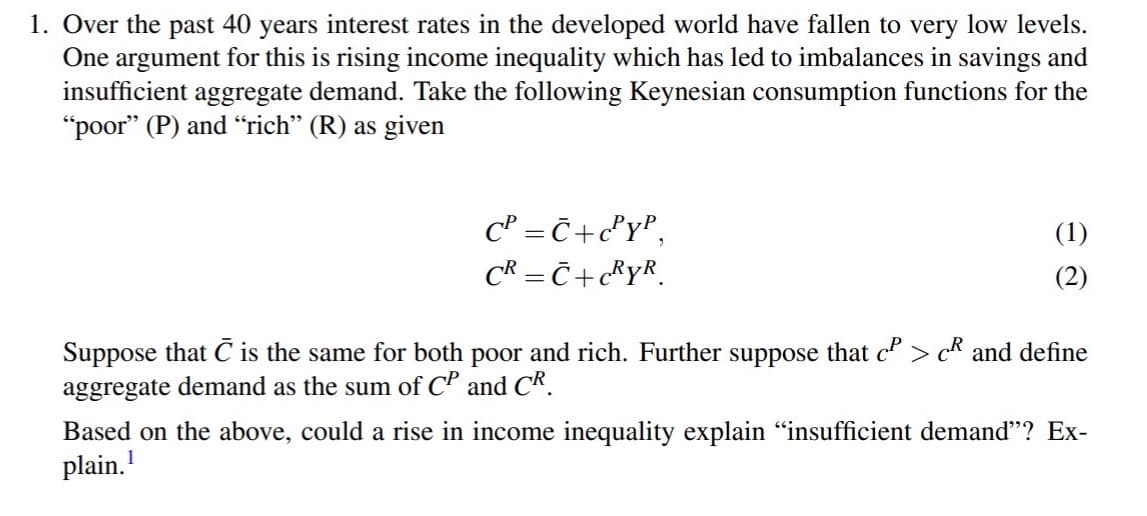
Trending now
This is a popular solution!
Step by step
Solved in 3 steps
- 1. In the Keynesian model, suppose that the economy has the following values : C = 100 + 0.75*Y G = 300 I = 200 NX = 0 (remember Y = GDP = C + I + G + NX) a) Solve for the level of equilibrium output in this economy. b) What is the MPC in this economy? What is the multiplier on government spending? (I want a specific number here, not a definition) c) Household savings is defined as income minus consumption (S = Y – C). What is the level of household savings in this economy? d) Suppose that households become nervous about the future of the economy and decide that they will consume less and save more money, so their new consumption function becomes C = 100 + 0.6*Y Solve for the new equilibrium level of output and calculate how much households end up saving. How has it changed from the level of savings in part c? e) How much does the government needs to increase its spending by to counteract the fall in economic output in this model?5 3. permanent Income Hypothesis a) suppose that beta=.9 and R= 2222 (that is ~22%). For an individual who acts according to the PIH, will their consumption next period be higher than current consumption or lower? b) What is the main crucial difference between the Keynesian Consumption function and the consumption function derived from the PIH (or Lifetime Income Hypothesis)? c) If Present Value of future income stream is 500,000 and a person has a beta of.8, how much will their consumption go up today if only today's income increases by 1000? How much will their consumption increase (approximately) if their income goes up by 1000 in all periods?Elaborate on the difference between a binding and non-binding borrowing constraints and thetwo consumption functions that result.b. From the Intertemporal Choice Model, many theories (non-Keynesian theories ofConsumption) came into being. Using graphical and mathematical expressions, compareand contrast the following theories on consumption behaviours:i. Franco Modigliani: Life-Cycle Hypothesisii. Milton Friedman: Permanent-Income Hypothesisiii. Robert Hall: Random Walk Hypothesis
- It is found that the consumption function for the economy is C = 50 + 0.8 Y d . Current level of output is 8800 and the potential GDP is 9000. Assuming the Keynesian view of the short run, answer the following questions. Illustrate this economy using a carefully labeled diagram. What is a larger concern for this economy: unemployment or inflation? If the economic policy makers want to bring the level of output to the potential GDP by changing the government expenditures (G), how much do they need to change G? Be sure to indicate whether the change is an increase or decrease. True or False and explain: If the policy in part c was successful, the unemployment rate will be zero.It appears that there was an economic drop during the 2019-2021 period as a result of the pandemic. Assume that we can view this as a negative shock to private investment, due to a combination of lockdowns and uncertainty about the world. In under 150 words, answer the following question: Was government consumption expenditure used as stabilisation policy following the slow-down during 2020 and 2021? (Note, you only need to discuss this in terms of our demand model of Income-Expenditure, IS-MPR, and Aggregate Demand.) Year Government consumption per capita ($) (rounded to a whole number) 2003 6672 2004 6820 2005 7016 2006 7394 2007 7515 2008 7757 2009 8040 2010 7892 2011 7931 2012 7969 2013 7955 2014 8041 2015 8154 2016 8124 2017 8096 2018 8238 2019 8371 2020 8658 2021 9207 2022 996216. Consider a closed economy with demand for goods as follows: Yd = C+I+G C= 200+0.80 ( Y-T) I= 600 G=1000 T=1000 a. What is “autonomous expenditure” ( Eo) for this economy? hint: the Keynesian cross model of income determination.
- 1. Induced consumption is: (a) the part of consumption which is independent of the level of income.(b) the minimum level of consumption that is financed from sources otherthan income.(c) The maximum level of consumption that is financed from sources otherthan income.(d) shown by the slope of the consumption function.2. In the Keynesian model, an introduction of a proportional tax will: (a) increase the slope of the consumption function.(b) reduce the multiplier.(c) increase the equilibrium level of income.(d) increase the multiplier.3. A decrease in the price level will: (a) shift the AS curve to the left.(b) shift the AD curve to the left.(c) shift the AS curve to the right.(d) leave both the AD curve and the AS curve unchanged.Suppose a closed economy has an aggregate consumption function given by C = 300 + 0.75Yd and generates $2200 output and income in equilibrium. Suppose also that the government collects a lump-sum tax of 300. How much will the private sector be saving total in equilibrium? (round your answer to the nearest whole value)Set 1: Equilibrium output1.Government. Suppose the consumption function is given by C= 100+ .8Y, while investment is given by I= 50 a) What is the equilibrium level of income in this case?b) What is the level of saving in equilibrium? c) If, for some reason, output is at the level of 800, what will the level of involuntary inventory accumulation be?d) If I rises to 100 (we discuss what determines I in later chapters), what will the effect be on the equilibrium income?e) What is the value of the multiplier, a, here?f) Draw a diagram indicating the equilibria in both (a) (d). 2.Suppose the consumption behaviour in problem 1 changes so that C= 100+ .9Y, while I remains at 50.c) Does this change in investment spending have more or less of an effect on Y than it did in problem 1? Why?d) Draw a diagram indicating the change in equilibrium income in this case.
- Set 1: Equilibrium output1.Government. Suppose the consumption function is given by C= 100+ .8Y, while investment is given by I= 50 a) What is the equilibrium level of income in this case?b) What is the level of saving in equilibrium? c) If, for some reason, output is at the level of 800, what will the level of involuntary inventory accumulation be?d) If I rises to 100 (we discuss what determines I in later chapters), what will the effect be on the equilibrium income?e) What is the value of the multiplier, a, here?f) Draw a diagram indicating the equilibria in both (a) (d). 2.Suppose the consumption behaviour in problem 1 changes so that C= 100+ .9Y, while I remains at 50.a) Is the equilibrium level of income higher or lower than it was in problem 1(a)? Calculate the new equilibrium level, Y', to verify this.b) New suppose investment increases to I= 100, just as in problem 1(d). What is the new equilibrium income?c) Does this change in investment spending have more or less of an effect…Question Two a. Explain the difference between a binding and non-binding borrowing constraints and thetwo consumption functions that result.b. From the Intertemporal Choice Model, many theories (non-Keynesian theories ofConsumption) came into being. Using graphical and mathematical expressions, compareand contrast the following theories on consumption behaviours:i. Franco Modigliani: Life-Cycle Hypothesisii. Milton Friedman: Permanent-Income Hypothesisiii. Robert Hall: Random Walk HypothesisQuestion 17 – Question 20: In this question, interest rate and prices are held fixed, and the economy can be described by the income-expenditure model. Consumption: C = 190 + 0.8YD; where YD = disposable income Investment: I = 180 – 50i, where i = 0.1 (10% & it is held fixed) Government spending: G = 183 Taxes: T = 272 Transfers: TR = 57 Exports: X = 18 Imports: IM = 24 Question 17 If the current level of output is 1975, find the levels of national savings and unplanned investment. Be sure to show your work rounded your answer to 2 decimal places if necessary