P Quantity Demanded (in kgs) 100 90 80 70 1. Plot and graph the data on the supply curve. 60 50 40 P Price (Php) 50.00 60.00 70.00 80.00 90.00 100.00 110.00 4. Plot and graph the data on the supply curve. P Figure 1: Price and Quantity Supplied of Tilapia Legend: P-Price, S-Supply, Qd - Quantity Demanded 5. Analyze the data and describe the curve. S 2. Analyze the data and describe the supply curve. 3. Compute the elasticity of demand and supply with an implication based on the estimated results. D D Figure 2: Price and Quantity Demanded of Tilapia Legend: P-Price, D - Demand, Qd- Quantity Demanded Quantity Supplied (in kgs) 40 50 6. Using the data from the demand and supply, determine the equilibrium point of the demand and supply curves. S 60 70 Figure 3: Equilibrium Price 80 90 100 Qd Qd Qd 7. How much is the price in the equilibrium point? 8. Suppose the price of rice is P85.00. Is the quantity demanded will be lower or higher than at the equilibrium price of P80.00 per kilo? Is the quantity supplied be lower or higher? Is there a shortage or a surplus in the market? If so, how much?
P Quantity Demanded (in kgs) 100 90 80 70 1. Plot and graph the data on the supply curve. 60 50 40 P Price (Php) 50.00 60.00 70.00 80.00 90.00 100.00 110.00 4. Plot and graph the data on the supply curve. P Figure 1: Price and Quantity Supplied of Tilapia Legend: P-Price, S-Supply, Qd - Quantity Demanded 5. Analyze the data and describe the curve. S 2. Analyze the data and describe the supply curve. 3. Compute the elasticity of demand and supply with an implication based on the estimated results. D D Figure 2: Price and Quantity Demanded of Tilapia Legend: P-Price, D - Demand, Qd- Quantity Demanded Quantity Supplied (in kgs) 40 50 6. Using the data from the demand and supply, determine the equilibrium point of the demand and supply curves. S 60 70 Figure 3: Equilibrium Price 80 90 100 Qd Qd Qd 7. How much is the price in the equilibrium point? 8. Suppose the price of rice is P85.00. Is the quantity demanded will be lower or higher than at the equilibrium price of P80.00 per kilo? Is the quantity supplied be lower or higher? Is there a shortage or a surplus in the market? If so, how much?

Chapter5: Elasticity Of Demand And Supply
Section: Chapter Questions
Problem 3.6P: (Price Elasticity of Supply) Calculate the price elasticity of supply for each of the following...

Related questions
Question
100%
ANSWER 7-8 ONLY
Transcribed Image Text:P
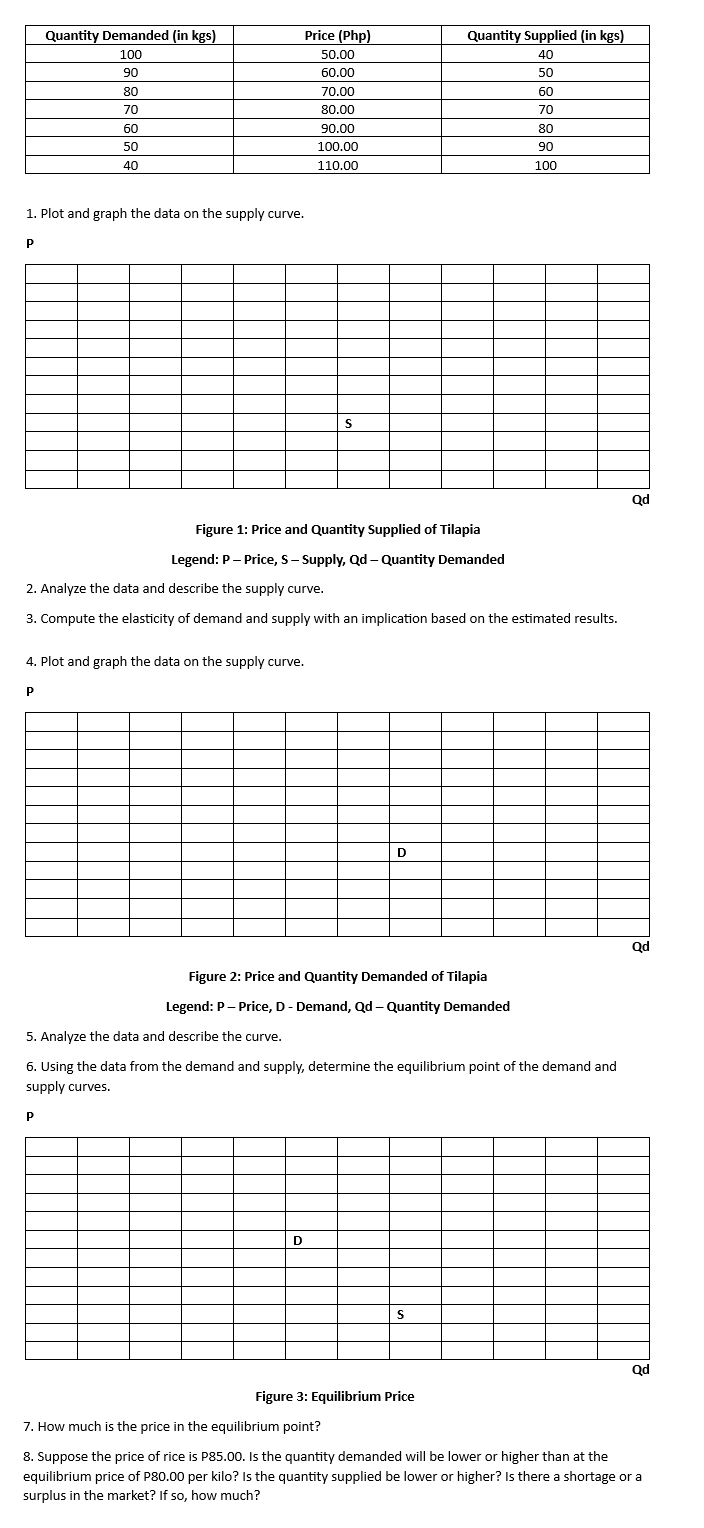
1. Plot and graph the data on the supply curve.
Quantity Demanded (in kgs)
100
90
80
70
60
50
40
P
P
Price (Php)
50.00
60.00
4. Plot and graph the data on the supply curve.
70.00
80.00
90.00
100.00
110.00
2. Analyze the data and describe the supply curve.
3. Compute the elasticity of demand and supply with an implication based on the estimated results.
S
Figure 1: Price and Quantity Supplied of Tilapia
Legend: P-Price, S-Supply, Qd - Quantity Demanded
D
D
Quantity Supplied (in kgs)
40
50
60
70
80
90
100
Figure 2: Price and Quantity Demanded of Tilapia
Legend: P-Price, D - Demand, Qd - Quantity Demanded
5. Analyze the data and describe the curve.
6. Using the data from the demand and supply, determine the equilibrium point of the demand and
supply curves.
S
Figure 3: Equilibrium Price
Qd
Qd
Qd
7. How much is the price in the equilibrium point?
8. Suppose the price of rice is P85.00. Is the quantity demanded will be lower or higher than at the
equilibrium price of P80.00 per kilo? Is the quantity supplied be lower or higher? Is there a shortage or a
surplus in the market? If so, how much?
Expert Solution
This question has been solved!
Explore an expertly crafted, step-by-step solution for a thorough understanding of key concepts.

Step by step
Solved in 3 steps with 2 images

Knowledge Booster


Learn more about
Need a deep-dive on the concept behind this application? Look no further. Learn more about this topic, economics and related others by exploring similar questions and additional content below.Recommended textbooks for you

Economics (MindTap Course List)
Economics
ISBN:
9781337617383
Author:
Roger A. Arnold
Publisher:
Cengage Learning

Economics (MindTap Course List)
Economics
ISBN:
9781337617383
Author:
Roger A. Arnold
Publisher:
Cengage Learning


Essentials of Economics (MindTap Course List)
Economics
ISBN:
9781337091992
Author:
N. Gregory Mankiw
Publisher:
Cengage Learning

Principles of Microeconomics
Economics
ISBN:
9781305156050
Author:
N. Gregory Mankiw
Publisher:
Cengage Learning