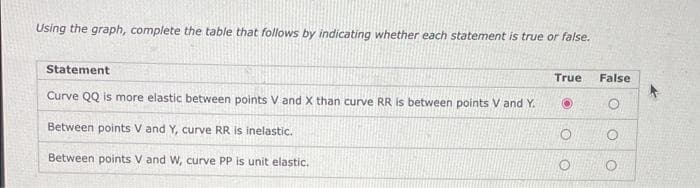
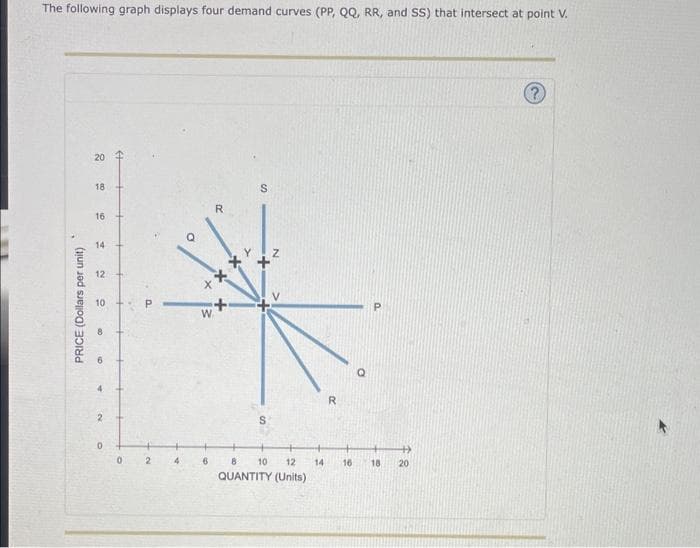
Using the graph, complete the table that follows by indicating whether each statement is true or false. Statement Curve QQ is more elastic between points V and X than curve RR is between points V and Y. Between points V and Y, curve RR is inelastic. Between points V and W, curve PP is unit elastic. True O O False O


Q: The game, "the battle of the sexes" (discussed in class) has pure strategy Nash Equilibria…
A: A pure strategy Nash equilibrium (PSNE) is a situation in which each player chooses a single,…
Q: Consider a world with only two countries (i.e., two large open economies), the home country and the…
A: Home CountryCd = 400 + 0.5(Y-T) - 100rwId = 300 - 100rwY = 2000T = 250G = 300Foreign CountryCd = 200…
Q: The table shows the demand and supply schedules for raspberries. Suppose that the government…
A: a) At supply of 5250 pounds per week market price of raspberries is $7.00 a pound (from the given…
Q: Consider a Cournot Duopoly model. The inverse demand for their products is given by P = 200 − 6Q,…
A: Cournot competition refers to the market where firms compete on the basis of the output. The…
Q: Assume an American firm takes a long position on British Pound call options. The premium is $0.05,…
A: A call option is a derivative that offers the right to purchase the underlying asset at a…
Q: Proportional
A: If low-income families pay 10% of their income in taxes while high-income families pay 20% of their…
Q: for th below two machines and based on AW analysis which machine we should select? MARR=10% Machine…
A: Present value is the value of investment in today's dollar. Future value is the value of investment…
Q: Using the midpoint method, the price elasticity of demand for a good is computed to be approximately…
A: The price elasticity of demand refers to the percentage change in quantity demanded in response to…
Q: Incomes increase. In the market for iPods (a normal good), we would expect O a. the supply curve to…
A: Consumer Income: In microeconomics, consumer income is the sum of money that purchasers have with…
Q: Bob has a utility function U(x, y) = √√x₁ +0.8√x2 +0.64√√x3 over his incomes x1, x2, x3 in the next…
A: Utility function: The utility function shows all those consumption bundles that give the quall level…
Q: Suppose consumers and businesses become more optimistic about future economic conditions, causing…
A: The following graph shows the aggregate demand (AD1) and aggregate supply (AS) curves for a…
Q: Which of the following could be the price elasticity of demand for a good for which a decrease in…
A: Price elasticity is the percentage change in quantity demanded due to change in price.
Q: Use the graph to answer the question. The marginal social benefit, marginal private benefit, and…
A: Positive externality refers to the spillover benefit of the good to the society, which is not…
Q: A small nation of 10 people idolizes the TV show The Voice. All they produce and consume are karaoke…
A: Consumer price index measures the average change in price over time in a fixed market basket of…
Q: 3. Now, Assume that Peruvian government responds by using monetary policy to stabilize output after…
A: When demand declines and unemployment increases, it is typical to anticipate a dramatic increase in…
Q: No written solution by hand You are hosting a workshop for your staff on communication and…
A: Retail business refers to the sale of goods or merchandise to individual consumers, typically in…
Q: c. What do you expect its price to be one year from now? (Use intermediate values rounded to 4…
A: * SOLUTION :- From the above information the calculation is given as below
Q: 1.) Briefly define and explain how fractional reserve banking works. Both the textbook and the…
A: 1. Fractional reserve banking is a banking system in which only a fraction of bank deposits is held…
Q: Compute for the Effective Interest Rate Payment Period = Monthly 1. 10% Compounded Yearly = Blank 1…
A: The effective interest rate is the real interest rate that is earned or paid on a loan or investment…
Q: Adding product differentiation to the Bertrand model has which of the following consequences: O It…
A: The Bertrand model is a simple economic model used to analyze competition between firms that produce…
Q: The classical dichotomy is the separation of real and nominal variables. The following questions…
A: Given information: Lucia spends all of her money on magazines and doughnuts. In 2013 she earned $15…
Q: Mary wants to buy equal amounts of sodas and candy bars for her party guests Sodas cost $.50 each…
A: A personal budget is a financial plan that details a person's earnings and outgoings over a…
Q: A situation where everybody plays a dominant strategy must be a Nash Equilibrium True False
A: The dominant strategy is the best course of action no matter what type of strategy is followed by…
Q: Consider a perfectly competitive market where the demand for the good is given by Q=769-5p, where Q…
A: Demand : Qd=769-5p Supply : Qs=-7+5p Equilibrium is a state of stable condition in the market…
Q: True/ False International trade can leads to a enhancement in the product available for the…
A: International trade refers to the exchange of goods and services across borders or between…
Q: Suppose the imaginary company of Roobek is a small, Cedar Rapids-based American apparel manufacturer…
A: Fixed costs refer to the costs of production that are not dependent on the output of a firm, i.e.,…
Q: Kate's money income is $350, the price of X is $4, and the price of Y is $6. Given these prices and…
A: Marginal Rate of Substitution (MRS), which is the rate at which a consumer is willing to trade one…
Q: Draw a well labeled graph (similar to graph 10.3 on page 283 from textbook) showing the point of…
A: The extra output that is created when one more unit of labour is employed while keeping all other…
Q: Children in poor neighborhoods have bleak outlooks on life and do not see much gain to studying. A…
A: Poverty refers to the state of being extremely poor, lacking the financial resources and material…
Q: Use the following graph and calculate the price elasticity of demand at the equilibrium.
A: Elasticity measures the responsiveness of the quantity demanded to the change in price. It measures…
Q: that actual Y is greater than equilibrium Y, Ye thus actual current Y>Ye. Explain the reaction by…
A: Aggregate expenditure equals the total amount of spending/expenditure on goods and services in an…
Q: CASHEWS (Pounds) 360 320 280 240 200 160 120 80 40 Brazil's PPF 1 2 3 4 5 6 7 8 9 10 PEANUTS…
A: Introduction: PPF (Production Possibility Frontier) It is graphical representation of all the…
Q: Use the graph below and the following information to answer the next question(s). The world price of…
A: Producer surplus is the difference between the price actually received and the minimum willingness…
Q: Graph the average total cost curve by first using the point tool to plot points for the average…
A: ATC: TC is the complete cost that is borne by a firm to produce all the units of a commodity. It is…
Q: Refer to the Figure below. Using the midpoint method, what is the price elasticity of supply between…
A: Price elasticity measures the percentage change in quantity due to percentage change in price. The…
Q: Is it appropriate for Fiji to undertake Fiscal consolidation? Justify your opinion.
A: Fiscal consolidation refers to a set of policies or measures implemented by a government to reduce…
Q: Q1. Consider the following graph for a pure monopoly firm selling electricity. Price 20.17 18.17…
A: Incase of monopoly , The profit is maximized where the marginal revenue is equal to the marginal…
Q: Why are 'network effects' considered to be a source of market power? O Because network effects allow…
A: Market power refers to the ability of a firm, or a group of firms, to control the price and/or…
Q: The game, "the battle of the sexes" (discussed in class) has pure strategy Nash Equilibria and mixed…
A: Nash equilibrium is a concept in game theory that describes a stable state of a game in which each…
Q: For the following events, explain the short-run and long-run effects on output and the price level,…
A: The graphic shows the Canadian economy with initial equilibrium at E. Price level PO and output…
Q: Health Econ 365 Part C Appalled by the answer to the previous questions, you set your scientist to…
A: Healthcare economics is the study of how resources are allocated and utilized in the healthcare…
Q: Which of the following best describes health care expenditure based on the level of education?…
A: Health care expenditure includes all expenditures for the provision of health services, nutrition…
Q: The "pizza connection" refers to the observation that in a major city, the cost of a slice of pizza…
A: CPI refers to an important economic metric. CPI Calculates the average change in prices paid by…
Q: 5. Consider a game with the following payoff table for player 1: Strategy Player 1 1 2 3 1 3 -4 1…
A: Strategy Player 2 1 2 3 1 33 −3-3 −2-2 Player 1 2 −4-4 −2-2 −1-1 3 11 33 2
Q: 25. The table provides some data for the United States in the first decade following the Civil War.…
A: 1) Given: In Year 1869 Money Supply (M) = $1.3 billion Velocity of money (V) = 4.50 Price level (P)…
Q: Suppose in a perfectly competitive industry that the market supply and demand forces combine to…
A: A perfectly competitive industry is a market form in which there exist many buyers and sellers, all…
Q: Suppose that you calculate the income elasticity of demand for ramen noodles to be 4. Based on this,…
A: Income elasticity is calculated as the percentage change in quantity divided by the percentage…
Q: Explain the content and purpose of a credit report?
A: A credit report is a detailed summary of a person's credit history and financial behavior. It…
Q: Assume the U.S. is a closed economy and that it is starting out in both SR and LR equilibrium.…
A: In the short run, the increase in mortgage rates and subsequent decrease in house prices will have a…
Q: Suppose the world price of tobacco falls significantly. The demand for labor among tobacco-producing…
A: A person who is able and ready to work finds themselves unemployed when they are unable to obtain…


Trending now
This is a popular solution!

Step by step
Solved in 3 steps


- The demand equation for a particular candy bar is px + x + 20p = 3000where 1000x candy bars are demanded per week when p cents is the price per bar. If the current price of the candy is 49 cents per bar and the price per bar is increasing at the rate of 0.2 cent each week, find the rate of change in the demand.You are presented with the following data from The Home Depot (THD) on sales of its Snowminator Snow Shovel during the winters of 2012-2015, throughout Canada. The product’s price (P), measured in Canadian Dollars, is: 26, 22, 18, 14, 10, 6, and 2. The corresponding quantity demanded (Qd) in the Northern part of the nation, measured in millions of shovels, was: 3, 6, 9, 12, 15, 18, and 21. While the corresponding quantity demanded, measured in millions of shovels, in the Southern part of the nation was: 4, 6, 8, 10, 12, 14, and 16. Assume all the data was retrieved internally from The Home Depot. In two separate graphs that you have created using Excel, clearly and accurately graph the demand and total revenue curves for the Northern part of Canada. These will be graph # 1 and # 2, respectively. In a separate graph from part A above, clearly and accurately graph the demand curve for the Southern part of Canada. This will be graph # 3. Solely consider your graphs and data in…For the following demand function begin mathsize 18px style Q open parentheses P close parentheses equals 540 minus 8 P end style What is the quantity demand when P=$35? Calculate the derivative for the demand function in the previous question and evaluate it at the price in the previous question
- Spreadsheet exercises. Suppose that the market for video games is competitive with demand function Qd = 130 − 4p + 2Y + 3pm − 2pc, where Qd is the quantity demanded, p is the market price, Y is the monthly budget that anaverage consumer has available for entertainment, pm is the average price of a movie, and pc is the price of a controller that is required to play these games. Given that Y = $100, pm = $30, and pc = $30, use Excel to calculate quantity demanded for p = $10 to p = $80 in $5 increments. Use Excel’s charting tool to draw the demand curve. Let Y = $100, pm = $30, and pc increase to $40. Recalculate the demand schedule in part 1 and use Excel to draw the new demand curve.The demand and supply curves for composition notebooks can be described by the followingequations: Demand Qd = 100-20P, Supply Qs = 10+40P Question 1.Complete a demand schedule and a supply schedule for composition notebooks based onthe prices $0.5, $1.00, $1.50, $2.00 and $2.50Viking InterWorks is one of many manufacturers that supplies memory products to original equipment manufacturers (OEMs) of desktop systems. The CEO recently read van article in a trade publication that reported the projected demand for desktop systems to be Qddesktop = 1,600 −2Pdesktop + .6M (in millions of units), where Pdesktop is the price of a desktop system and M is consumer income. The same article reported that the incomes of the desktop systems’ primary consumer demographic would increase 4.2 percent this year to $61,300 and that the selling price of a desktop would decrease to $980, both of which the CEO viewed favorably for Viking. In a related article, the CEO read that the upcoming year’s projected demand for 512 MB desktop memory modules is Qdmemory = 11,200 − 100Pmemory − 2Pdesktop (in thousands of units), where Pmemory is the market price for a 512 MB memory module and Pdesktop is the selling price of a desktop system. The…
- The demand side of the market for Sprite is comprised of 2 people. These people are William and Owen. P represents the price of 1 gallon of Sprite, and Qd represents the quantity demanded of Sprite in gallons. William's demand for Sprite is modeled by the equation QdW = 10 - 2P Owen's inverse demand for Sprite is modeled by the equation P = 10 - 2QdO (Part I) With this information, draw the market demand graph. Please label the graph for slope values, intercepts, kinks, etc. (Part II) The market supply is modeled by P = Qs. Let's say that the government places a subsidy of $8 (s = 8). As a result, what is the market equilibrium with this intervention of the government (Q**, PD**, and PS**)? (Part III) Please draw the market demand and market supply on a new graph and indicate/label the market equilibrium with the government intervention through a subsidy. Label the graph for slopes, subsidy, equilibrium points, etc.Spreadsheet exercises. Suppose that the market for video games is competitive with demand function Qd = 130 − 4p + 2Y + 3pm − 2pc, where Qd is the quantity demanded, p is the market price, Y is the monthly budget that anaverage consumer has available for entertainment, pm is the average price of a movie, and pc is the price of a controller that is required to play these games. 1. Given that Y = $100, pm = $30, and pc = $30, use Excel to calculate quantity demanded for p = $10 to p = $80 in $5 increments. Use Excel’s charting tool to draw the demand curve. 2. Now, Y increases to $120. Recalculate the demand schedule in part 1. Use Excel’s charting tool to draw the new demand curve in the same diagram. 3. Let Y = $100 and pc = $30 again, but let pm increase to $40. Recalculate the demand schedule in part 1. Use Excel’s charting tool to draw the graph of the new demandcurve. 4. Let Y = $100, pm = $30, and pc increase to $40. Recalculate the demand schedule in part 1 and use Excel to draw…use the demand function below to answer the questions that follows Qdx = 3/4 - 1/3Px - 5Py + 2Pz - 2/10M d. interpret px
- Subject: Manegerial Economics & Policy The maker of a leading brand of low-calorie microwavable food estimated the following demand equation for its product using data from 26 supermarkets around the country for the month of April: Q = -5,200 - 42P + 20PX + 5.2l + 0.20A + 0.25M (2.002) (17.5) (6.2) (2.5) (0.09) (0.21) R2 = 0.55 n = 26 F = 4.88 Assume the following values for the independent variables: Q = Quantity sold per month P (in cents) = Price of the product = 500 PX (in cents) = Price of leading competitor’s product = 600 I (in dollars) = Per capita income of the standard metropolitan statistical area (SMSA) in which the supermarket is located = 5,500 A (in dollars) = Monthly advertising expenditure = 10,000 M = Number of microwave ovens sold in the SMSA in which the supermarket is located = 5,000 Using this information, answer the following questions: Compute elasticities for each variable. Do you think that this firm should cut its price to increase its market…Subject: Manegerial Economics & Policy The maker of a leading brand of low-calorie microwavable food estimated the following demand equation for its product using data from 26 supermarkets around the country for the month of April: Q = -5,200 - 42P + 20PX + 5.2l + 0.20A + 0.25M (2.002) (17.5) (6.2) (2.5) (0.09) (0.21) R2 = 0.55 n = 26 F = 4.88 Assume the following values for the independent variables: Q = Quantity sold per month P (in cents) = Price of the product = 500 PX (in cents) = Price of leading competitor’s product = 600 I (in dollars) = Per capita income of the standard metropolitan statistical area (SMSA) in which the supermarket is located = 5,500 A (in dollars) = Monthly advertising expenditure = 10,000 M = Number of microwave ovens sold in the SMSA in which the supermarket is located = 5,000 Using this information, answer the following questions: (remaining parts) Interpret your results for each variable. What proportion of the variation in sales is explained by the…Subject: Manegerial Economics & Policy The maker of a leading brand of low-calorie microwavable food estimated the following demand equation for its product using data from 26 supermarkets around the country for the month of April: Q = -5,200 - 42P + 20PX + 5.2l + 0.20A + 0.25M (2.002) (17.5) (6.2) (2.5) (0.09) (0.21) R2 = 0.55 n = 26 F = 4.88 Assume the following values for the independent variables: Q = Quantity sold per month P (in cents) = Price of the product = 500 PX (in cents) = Price of leading competitor’s product = 600 I (in dollars) = Per capita income of the standard metropolitan statistical area (SMSA) in which the supermarket is located = 5,500 A (in dollars) = Monthly advertising expenditure = 10,000 M = Number of microwave ovens sold in the SMSA in which the supermarket is located = 5,000 Using this information, answer the following questions: (remaining parts) Do you think that this firm should cut its price to increase its market share/revenue? Explain. What…

