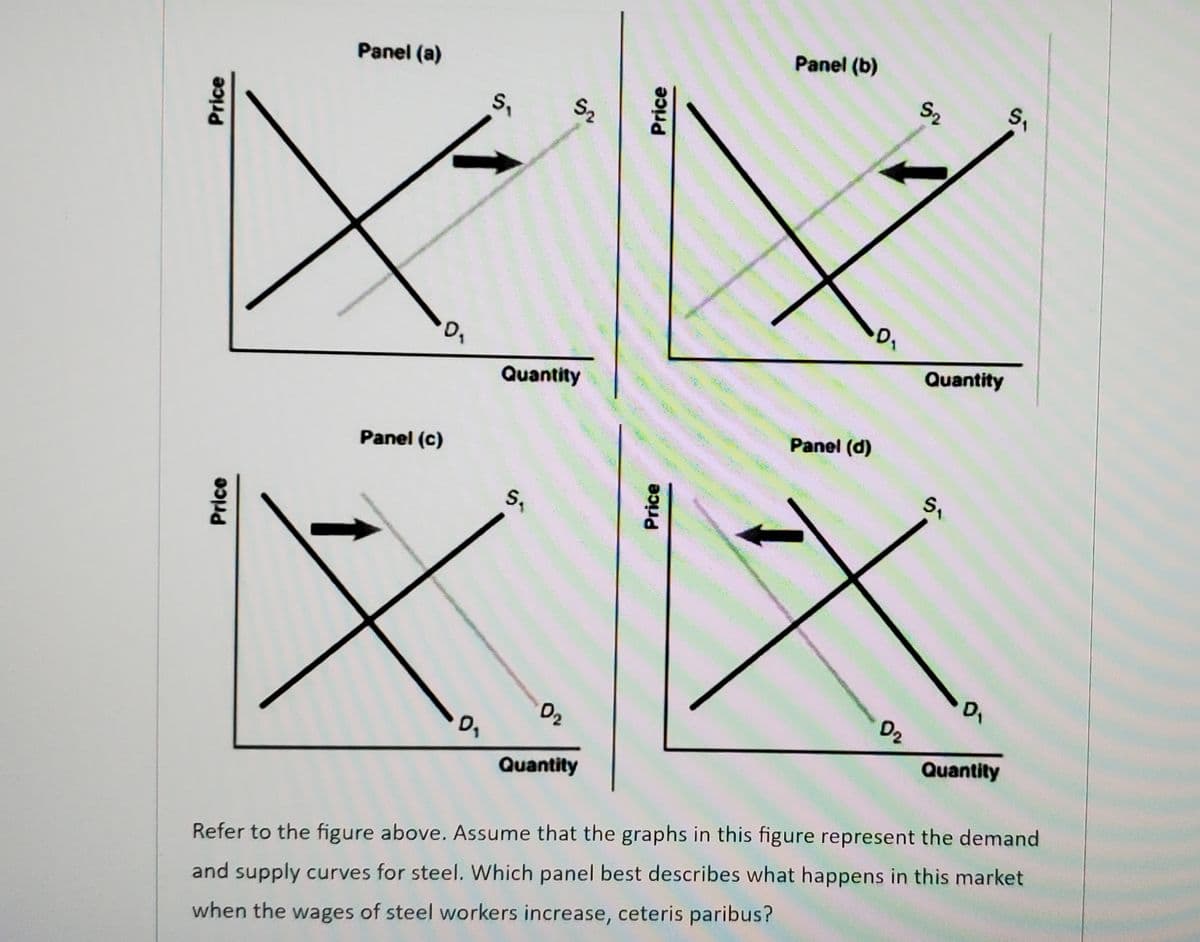
Panel (b) Panel (a) ら、 S2 Quantity Quantity Panel (d) Panel (c) D2 Quantity Quantity Refer to the figure above. Assume that the graphs in this figure represent the demand and supply curves for steel. Which panel best describes what happens in this market when the wages of steel workers increase, ceteris paribus? Price の Price Price 57 52 Price S,


Q: The supply and demand functions for a product are 9s = 4p2 – 500 and qa = 3p² – 20p + 1000 .…
A: Supply means different quantities are supplied at different prices. It means the supply curve is…
Q: Problem 5: Consider the following supply schedule for bags. Quantity rice Supplied $10 433 $20 463…
A: GIVEN : Consider the following supply schedule for bags. rice Quantity Supplied $10…
Q: 1. The price-demand equations x = f(p, q) and y = g(p, q) represent the num- ber of units demanded…
A: Since we only answer up to 3 sub-parts, we’ll answer the first 3. Please resubmit the question and…
Q: 3. A pizza producer is using Mozzarella cheeze as one input in his production of his pizza.…
A: With the increase in the supply of good the supply curve shifts towards right and with decrease in…
Q: Suppose the price of cotton (a production input for t-shirts) falls, which causes the quantity of…
A: Given Price ($) Quantity demanded per year Quantity supplied per year (When the price of cotton…
Q: Determine the market equilibrium price and quantity for the following markets: a) Qs= -20 + 3P, Qd=…
A: The demand for a quantity(Qd) depends upon the price of that quantity and also on other factors such…
Q: How might companies in the steel and petrol industry react to an increase in the price of bauxite?
A: d) Bauxite is used in a lot of industries like the chemical industry, refractory, abrasive, cement,…
Q: čubic per 100 During a three month period the price of natural gas decreased from $4.81 per cu ft.…
A: Given Information: a) initial price (P1)= $4.81 (per 1,000 cu ft) b) initial quantity (Q1)=62.21…
Q: Activity 2. The Law of Demand and Supply Directions: Analyse this problem. The following data were…
A: Answer (2.1): The graphical presentation of the demand curve is given below: According to the above…
Q: (1) illegal beer poses a great challenge to the beer market, explain how it affect domestics beer…
A: Illegal beer increases the supply of beer in the market. An increase in supply shifts the supply…
Q: f ... 3 D JM 83% i 9:35 a.m. Units 4 and 5 Worksheet Question 3b The government in your country is…
A: Answer - "Thank you for submitting the question . But we are authorized to solve one question at a…
Q: PROBLEM SET 2 Supply and Demand DEMAND/SUPPLY SCHEDULE 1 DEMAND/SUPPLY…
A: 5. Change in demand/supply represent a movement along the demand/supply curve thanks to change in…
Q: a) the supply and b) the demand for sugar is price inelastic. Justify your choices that a) the…
A: Elasticity refers to the change in one variable due to the change in other variable. Price…
Q: Remaining Time: 19 minutes, 36 seconds. * Question Completion Status: Exhibit 3-8 shows demand and…
A: Demand Schedule refers to the tabular representation of different quantities demanded at different…
Q: item prices and the amölin 020 are Use 1990 as the base. Item Price (1990 ) Quantity (1990) Price…
A: Fisher's Index The Fisher Index, which is computed as the geometric mean of the Laspeyres Price…
Q: Problem 3-5 (Algorithmic) The demand and supply for a particular commodity are given by the…
A: The demand and supply for a perticular commodity are given by the following two equations.
Q: Panel (b) Panel (a) S2 S2 Quantity Quantity Panel (d) Panel (c) D2 Quantity Quantity Refer to the…
A: A demand curve shifts if there is a change in the demand component except for price, demand…
Q: Market for Product X S. Price floor .-- -- --- II IV Quantity Which numeral represents the…
A: Demand curve represents the quantity of the good demanded by the consumers at different prices…
Q: Answer the question based on the glven supply and demand data for wheat. Bushels Demanded Price Per…
A: The demand curve is downward sloping in the case of a normal good and it is upward sloping in the…
Q: Eq price in ice Quantity Demanded Quantity Supplied $10 10 60 $8 20 45 $6 30 30 $4 40…
A: In economics, quantity demanded refers to the total amount of a good or service that consumers…
Q: Alex DMarket 16 14 12 Price John Liz $1 20 19 18 17 8. 7 3 4 10 4 3 16 15 6. 7 14 4. 8. 13 2 b. If…
A: Market Demand is calculated by adding all the individual demands at each price. So, the following…
Q: S 2 Price S1 B D2 Quantity Figure 4
A:
Q: Economics PROBLEM SET 2 Supply and Demand DEMAND/SUPPLY SCHEDULE 1…
A: Since we only answer up to 3 sub-parts, we’ll answer the first 3. Please resubmit the question and…
Q: of raw s
A: Sugar is basically refined sugar from cane and beet molasses squeeze made.
Q: Quantity Supplied Quantity Demanded (pounds) Pricer (Per pound) (pounds) $7 80 30 $6 70 45 $5 60 60…
A: Equilibrium is attained in the market at the point where the demand curve and the supply curve…
Q: Pc 0.01Ps and a supply equation: Qs = 0.1p - 0.02p; + 0.01N + 0.01T - 0.1w where p = price of the…
A: supply and demand, refers to the relationship between the quantity of a commodity that producers…
Q: he Organisation of Petroleum Exporting Countries (OPEC) is holding a regular meetir o decide on its…
A: OPEC is an intergovernmental organization which involves 13 countries. It is founded on14th…
Q: PRESYO QUANTITY SUPPLY (QS) QUANTITY DEMAND (QD) 10 20 32 10 25
A: The equilibrium price and equilibrium quantity of a good sold in the market are determined by the…
Q: 1. Plot the graph with demand and supply curves using this schedule. (Use table below)
A: Since you have asked multiple questions, we will solve the first question for you. If you want any…
Q: The demand equation is 4,750,000 -1700P and the supply equation is -1,250,000 + 1300P. Solve for the…
A: Equilibrium is achieved in the market at the output level where quantity supplied equals quantity…
Q: The price of raw sugar recently reached its highest level since 1981 due to problems with supply.…
A: Equilibrium is at such a price, where the quantity demanded equals quantity supplied.
Q: Is given: Qd = 90 – P, Qs = 2P - 60 The task is to: a) Calculate market equilibrium price and…
A: Market equilibrium is the price in a market at which the quantity demanded and the quantity…
Q: nomics Volume of Production Price (dollars) Total Production Cost (dollars) 10 1434 22841 30 991…
A: Dear learner you have posted multiple questions, as per our policy we have solved only first…
Q: 10. Market: Cheese this month Increase or Decrease: Scenario: Prices are expected to fall next…
A: Demand theory: The demand theory states that when the price of the commodity increases in the…
Q: B- If the relationship between supply and demand for a given commodity is linear such that…
A: The demand for a good shows the quantity demanded of a good with different levels of prices. The…
Q: Question#3 Assuming hypothetical equilibrium in Demand/Supply Model of Apples, illustrate impact of…
A: Note: Since we only answer up to 3 sub-parts, we’ll answer the first 3. Please resubmit the question…
Q: dividual and market supply ose that Charles and Dina are the only suppliers of shoes in a particular…
A:
Q: By equating the Demand Curve ??? = 24 − 2 ?? and Supply Curve ??? = 4?? equations; (a) Determine the…
A: Demand curve:P=24-2QSupply curve:P=4Q
Q: a) The inverse demand and supply functions for a commodity are Pa = 400 – 0.3Q P, = 40 + 0.3Q Where…
A: Disclaimer :- as you posted multiple questions we are supposed to solve the first one only. Market…
Q: Retail demand: Q=16-pr Farm Supply: Q=2+.5Pf Marketing Cost per unit: $5 Fill in the table to…
A: "Since you have posted multiple sub-part question, I can only answer the first 3 parts, rest your…
Q: Table 2.2: Supply of Units of Pizza (in a Month) in a Small Town Prices Firm A Firm B Firm C $4 10 4…
A: There are generally two terms: Quantity supplied and supply When price remains same and other…
Q: The annual demand for imported oranges is given by the following equation: QD = 600,000 − 30,000P…
A: Revenue is the amount received from the sale of output. Revenue = Price*Output
Q: (1) RELATED RATES. Provide all details as demonstrated in class. x= chronological order of the…
A: * SOLUTION :- (1) a) From the given information the calculation is given below ,
Q: Note: Plot your points in the order in which you would like them connected. Line segments will…
A: Price Quantity demanded Quantity Supplied 4 2000 200 8 1600 600 12 1200 800 16 800 1200 20…
Q: Module 3 Quiz 1 3 4. 5 7 8 10 11 12 13 14 15 16 8 Which statement(s) are most likely correct about…
A: Answer: According to the "Law of supply" there is a positive or direct relationship between the…
Q: A.) a.1 Plot or graph the data. Interpret the results. Price (S per gallon) 1.00 1.20 1.40 1.60 1.80…
A:
Q: Price Question 3 What would happen to equilibrium price and equilibrium quantity of khaki pants…
A: Equilibrium in the market occurs at the intersection of demand and supply curves.
If you help answer quickly and correctly I will give a thumbs up! Thank you! :)


Trending now
This is a popular solution!

Step by step
Solved in 3 steps

- Subject: Manegerial Economics & Policy The maker of a leading brand of low-calorie microwavable food estimated the following demand equation for its product using data from 26 supermarkets around the country for the month of April: Q = -5,200 - 42P + 20PX + 5.2l + 0.20A + 0.25M (2.002) (17.5) (6.2) (2.5) (0.09) (0.21) R2 = 0.55 n = 26 F = 4.88 Assume the following values for the independent variables: Q = Quantity sold per month P (in cents) = Price of the product = 500 PX (in cents) = Price of leading competitor’s product = 600 I (in dollars) = Per capita income of the standard metropolitan statistical area (SMSA) in which the supermarket is located = 5,500 A (in dollars) = Monthly advertising expenditure = 10,000 M = Number of microwave ovens sold in the SMSA in which the supermarket is located = 5,000 Using this information, answer the following questions: (remaining parts) Interpret your results for each variable. What proportion of the variation in sales is explained by the…Subject: Manegerial Economics & Policy The maker of a leading brand of low-calorie microwavable food estimated the following demand equation for its product using data from 26 supermarkets around the country for the month of April: Q = -5,200 - 42P + 20PX + 5.2l + 0.20A + 0.25M (2.002) (17.5) (6.2) (2.5) (0.09) (0.21) R2 = 0.55 n = 26 F = 4.88 Assume the following values for the independent variables: Q = Quantity sold per month P (in cents) = Price of the product = 500 PX (in cents) = Price of leading competitor’s product = 600 I (in dollars) = Per capita income of the standard metropolitan statistical area (SMSA) in which the supermarket is located = 5,500 A (in dollars) = Monthly advertising expenditure = 10,000 M = Number of microwave ovens sold in the SMSA in which the supermarket is located = 5,000 Using this information, answer the following questions: (remaining parts) Do you think that this firm should cut its price to increase its market share/revenue? Explain. What…Consider the scenario. Explain using written and graphical analysis What will happen in the market for wine if the price of cheese increases (wine andcheese are complements)?
- 1. Which of the following variables does not directly impact the quantity of a good the firm is willing to produce? a. the price of the good b. the income level of the people who buy the good c. the number of firms producing the good d. the cost of a key input used to produce the goodForecast the demand for the rice for a country for the year 2019 on the basis of 7-year data given in table: Year 2012 2013 2014 2015 2016 2017 2018 Population (millions) 10 12 15 20 25 30 40 Rice consumed (million tonnes) 40 50 60 70 80 90 100Suppose, suddenly the supply of mutton decreases due to unknown goat diseases.What would happen to the market of salad items? Would this event affect chutneymarket? Because of this decreased supply of mutton what would happen to the market ofKachchi biryanis, Morog Polaw, and chicken biryanis? Explain (in details) with relevantdiagrams/graphs
- The ____________________ is based on the prices ofmerchandise that are exported or imported. a)International PriceIndex b)Producer Price Index c)International ProductIndex d)Foreign Price IndexQUESTION “generic drug”contains the same active chemical ingredientas a drug that was previouslyprotected by a patent. Generic drugs are essentially the sameand are sold by many different, smallfirmsafter the original patent has expired. A well-known example is the antibiotic penicillin. The COVID-19 pandemic has seen high use of penicillin by those infected by the virus. Using the demand-supply model, analyse this change inconsumer preferencesregarding this drug. Examine the likely consequences in one or two related markets of your choice.Consider the scenario. Explain using written and graphical analysis What will happen in the market for lobster if the government rises the income taxand lobsters are a normal good?
- Note: this is an economics question. *Was the shortage of hand sanitizer, masks and disinfectant products during the covid-19 pandemic due to supply or demand? *Explain.Table 24-5The table below pertains to Wrexington, an economy in which the typical consumer’s basket consists of 20 pounds of meat and 10 toys. Year Price ofMeat Price of aToy 2004 $3 per pound $2 2005 $1 per pound $7 2006 $4 per pound $5 Refer to Table 24-5. The cost of the basket Group of answer choices increased from 2004 to 2005 and increased from 2005 to 2006. increased from 2004 to 2005 and decreased from 2005 to 2006. decreased from 2004 to 2005 and increased from 2005 to 2006. decreased from 2004 to 2005 and decreased from 2005 to 2006.nomics Volume of Production Price (dollars) Total Production Cost (dollars) 10 1434 22841 30 991 26408 35 917 23781 45 1020 29675 70 703 38801 100 298 44834 4. Compute the slope of the demand curve. The potential answers are: A: -12.89 B: -10.5 C: -11.33 D: -14.28 E: -10.64 5. Compute the maximum potential sales quantity. The potential answers are: A: 127 units. B: 125 units. C: 105 units. D: 116 units. E: 168 units . 6. What percentage of total costs can be estimated based on the volume of production? The potential answers are: A: 69% B: 97% C: 91% D: 94% E: 92%