A.) a.1 Plot or graph the data. Interpret the results. Price (S per gallon) 1.00 1.20 1.40 1.60 1.80 Quantity Demanded (millions of gallons) 800 700 600 550 500 460 420 B.) b.1 Plot or graph the data. Interpret the results Price (S per gallon) 1.00 1.20 1.40 1.60 1.80 2.00 2.20 Quantity Demanded (millions of gallons) 500 550 600 640 680 700 720 2.00 2.20 Table 3: Price and Supply of Gasoline Table 3: Price and Quantity Demanded of Gasoline Price Quantity Supplied Figure 4: Price and Supply of Gasoline Quantity Demanded Gasoline Figure 3: Price and Quantity Demanded of Gasoline C.) c.1 Using the data from demand and supply (refer to A & B), determine the equilibrium point of the demand and supply curves. Price Figure 4: The Equilibrium Price
A.) a.1 Plot or graph the data. Interpret the results. Price (S per gallon) 1.00 1.20 1.40 1.60 1.80 Quantity Demanded (millions of gallons) 800 700 600 550 500 460 420 B.) b.1 Plot or graph the data. Interpret the results Price (S per gallon) 1.00 1.20 1.40 1.60 1.80 2.00 2.20 Quantity Demanded (millions of gallons) 500 550 600 640 680 700 720 2.00 2.20 Table 3: Price and Supply of Gasoline Table 3: Price and Quantity Demanded of Gasoline Price Quantity Supplied Figure 4: Price and Supply of Gasoline Quantity Demanded Gasoline Figure 3: Price and Quantity Demanded of Gasoline C.) c.1 Using the data from demand and supply (refer to A & B), determine the equilibrium point of the demand and supply curves. Price Figure 4: The Equilibrium Price

Principles of Economics 2e
2nd Edition
ISBN:9781947172364
Author:Steven A. Greenlaw; David Shapiro
Publisher:Steven A. Greenlaw; David Shapiro
Chapter13: Positive Externalities And Public Goods
Section: Chapter Questions
Problem 25P: Becky and Sarah are sisters 1who share a room. Their room can easily get messy, and their parents am...

Related questions

Question
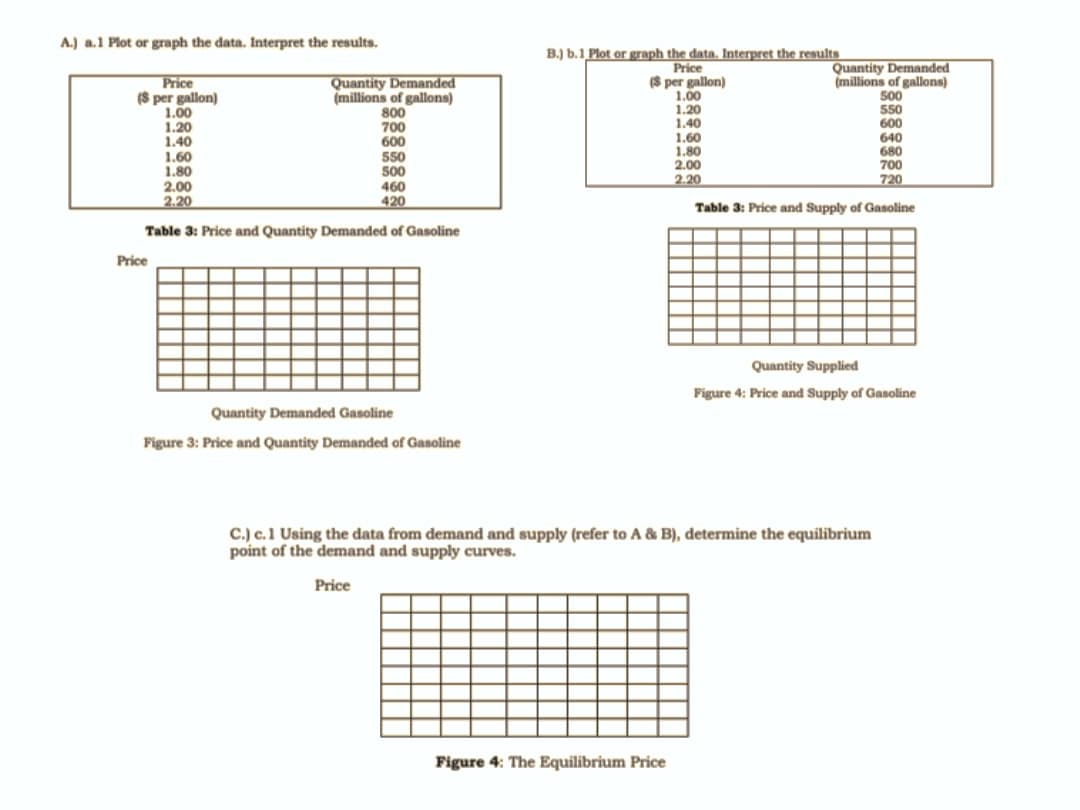
Transcribed Image Text:A.) a.1 Plot or graph the data. Interpret the results.
B.) b.1 Plot or graph the data, Interpret the results
Price
(S per gallon)
1.00
1.20
1.40
1.60
1.80
2.00
2.20
Price
(S per gallon)
1.00
1.20
1.40
1.60
1.80
2.00
2.20
Quantity Demanded
(millions of gallons)
800
700
600
550
500
Quantity Demanded
(millions of gallons)
500
550
600
640
680
700
720
460
420
Table 3: Price and Supply of Gasoline
Table 3: Price and Quantity Demanded of Gasoline
Price
Quantity Supplied
Figure 4: Price and Supply of Gasoline
Quantity Demanded Gasoline
Figure 3: Price and Quantity Demanded of Gasoline
C.) c.1 Using the data from demand and supply (refer to A & B), determine the equilibrium
point of the demand and supply curves.
Price
Figure 4: The Equilibrium Price
Expert Solution
This question has been solved!
Explore an expertly crafted, step-by-step solution for a thorough understanding of key concepts.

This is a popular solution!

Trending now
This is a popular solution!

Step by step
Solved in 2 steps with 2 images

Knowledge Booster


Learn more about
Need a deep-dive on the concept behind this application? Look no further. Learn more about this topic, economics and related others by exploring similar questions and additional content below.Recommended textbooks for you
Principles of Economics 2e
Economics
ISBN:
9781947172364
Author:
Steven A. Greenlaw; David Shapiro
Publisher:
OpenStax
Principles of Economics 2e
Economics
ISBN:
9781947172364
Author:
Steven A. Greenlaw; David Shapiro
Publisher:
OpenStax