Part 1 If the level of employee satisfaction drops below 0.60 overall, then there is a belief that there may be a serious problem with morale in that department. There have been rumors that the Human Resources department (hr in the data file) may be having just such issues. Using a statistical package, test to determine if the mean employee satisfaction level in the Human Resources department is less than 0.60. 1. Is satisfaction_level a qualitative or quantitative variable? 2. Graph the employee satisfaction level for
Part 1 If the level of employee satisfaction drops below 0.60 overall, then there is a belief that there may be a serious problem with morale in that department. There have been rumors that the Human Resources department (hr in the data file) may be having just such issues. Using a statistical package, test to determine if the mean employee satisfaction level in the Human Resources department is less than 0.60. 1. Is satisfaction_level a qualitative or quantitative variable? 2. Graph the employee satisfaction level for

Glencoe Algebra 1, Student Edition, 9780079039897, 0079039898, 2018
18th Edition
ISBN:9780079039897
Author:Carter
Publisher:Carter
Chapter10: Statistics
Section10.4: Distributions Of Data
Problem 20PFA

Related questions
Question
100%
Here's the data copy and paste it on your web browser. For a better view I think you can open it up on excel.
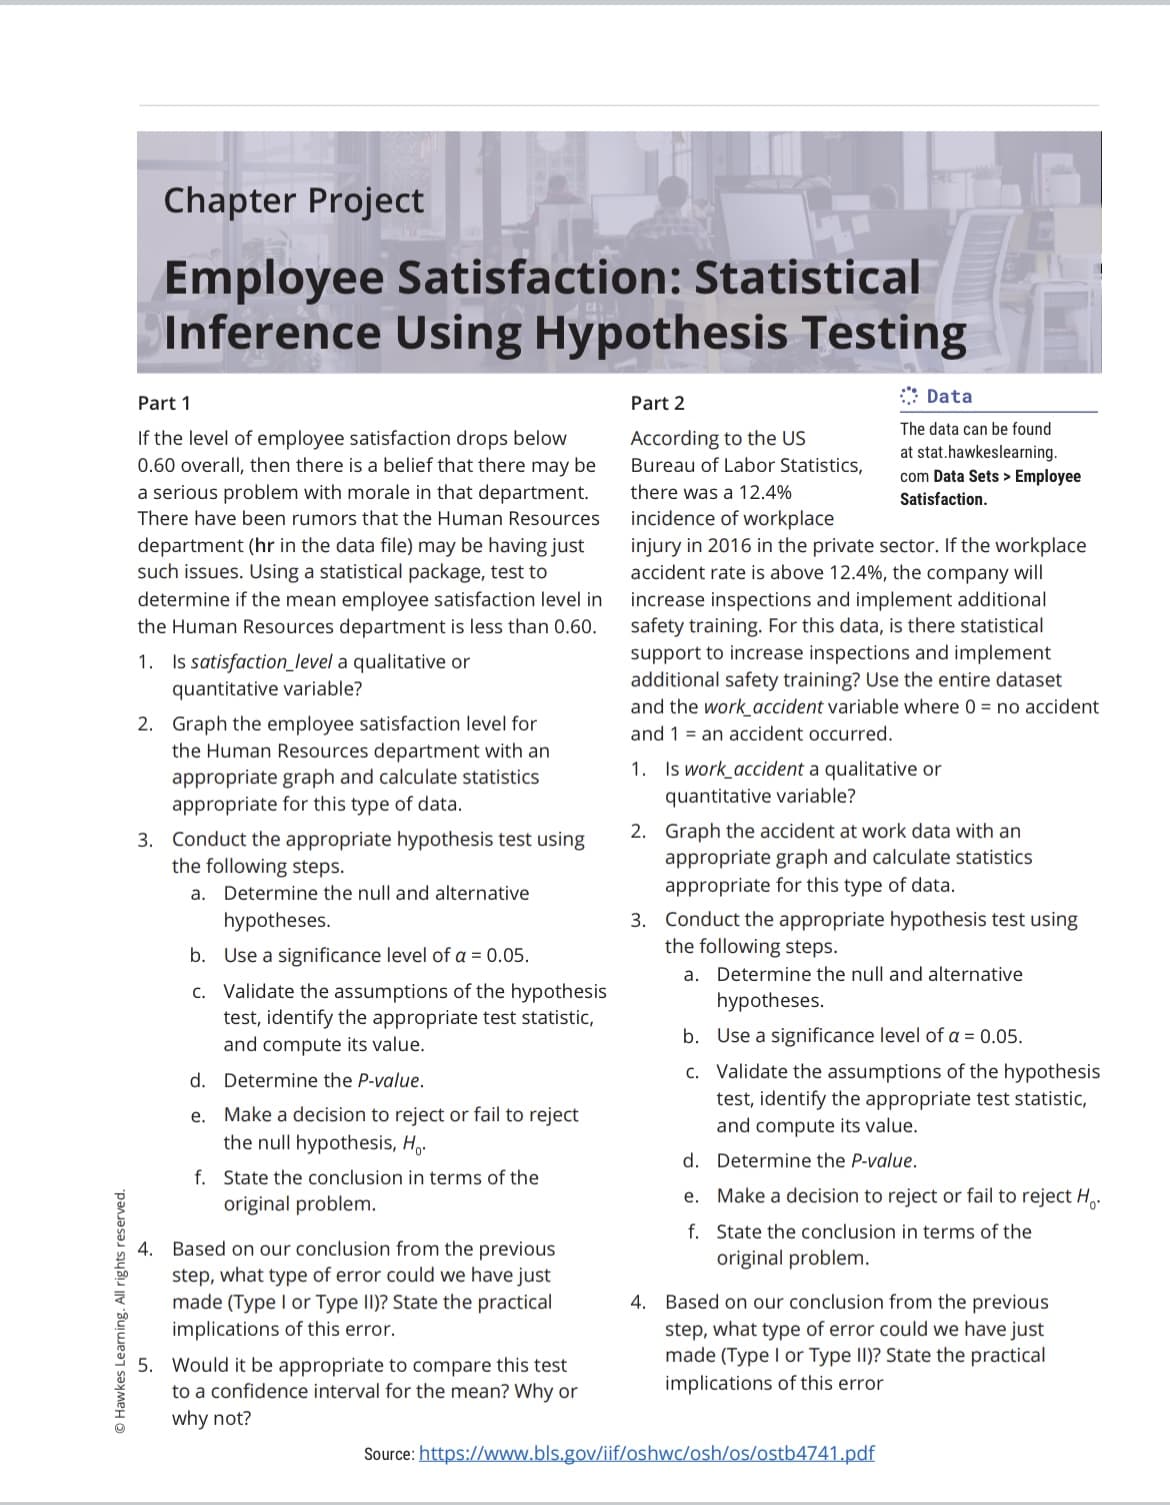
Transcribed Image Text:Chapter Project
Employee Satisfaction: Statistical
Inference Using Hypothesis Testing
:: Data
Part 1
Part 2
The data can be found
If the level of employee satisfaction drops below
0.60 overall, then there is a belief that there may be
According to the US
Bureau of Labor Statistics,
at stat.hawkeslearning.
com Data Sets > Employee
a serious problem with morale in that department.
there was a 12.4%
Satisfaction.
incidence of workplace
injury in 2016 in the private sector. If the workplace
accident rate is above 12.4%, the company will
There have been rumors that the Human Resources
department (hr in the data file) may be having just
such issues. Using a statistical package, test to
determine if the mean employee satisfaction level in
the Human Resources department is less than 0.60.
increase inspections and implement additional
safety training. For this data, is there statistical
support to increase inspections and implement
additional safety training? Use the entire dataset
and the work accident variable where 0 = no accident
and 1 = an accident occurred.
1. Is satisfaction_level a qualitative or
quantitative variable?
2. Graph the employee satisfaction level for
the Human Resources department with an
appropriate graph and calculate statistics
appropriate for this type of data.
1. Is work accident a qualitative or
quantitative variable?
3. Conduct the appropriate hypothesis test using
the following steps.
2. Graph the accident at work data with an
appropriate graph and calculate statistics
appropriate for this type of data.
a. Determine the null and alternative
3. Conduct the appropriate hypothesis test using
the following steps.
hypotheses.
b. Use a significance level of a = 0.05.
a. Determine the null and alternative
c. Validate the assumptions of the hypothesis
test, identify the appropriate test statistic,
and compute its value.
hypotheses.
b. Use a significance level of a = 0.05.
c. Validate the assumptions of the hypothesis
test, identify the appropriate test statistic,
and compute its value.
d. Determine the P-value.
e. Make a decision to reject or fail to reject
the null hypothesis, H..
d. Determine the P-value.
f. State the conclusion in terms of the
original problem.
e. Make a decision to reject or fail to reject H,
f. State the conclusion in terms of the
original problem.
4. Based on our conclusion from the previous
step, what type of error could we have just
made (Type I or Type II)? State the practical
implications of this error.
4. Based on our conclusion from the previous
step, what type of error could we have just
made (Type I or Type II)? State the practical
implications of this error
5. Would it be appropriate to compare this test
to a confidence interval for the mean? Why or
why not?
Source: https://www.bls.gov/iif/oshwc/osh/os/ostb4741.pdf
OHawkes Learning. All rights reserved.
Expert Solution
This question has been solved!
Explore an expertly crafted, step-by-step solution for a thorough understanding of key concepts.

This is a popular solution!

Trending now
This is a popular solution!

Step by step
Solved in 3 steps with 2 images

Recommended textbooks for you
Glencoe Algebra 1, Student Edition, 9780079039897…
Algebra
ISBN:
9780079039897
Author:
Carter
Publisher:
McGraw Hill

Big Ideas Math A Bridge To Success Algebra 1: Stu…
Algebra
ISBN:
9781680331141
Author:
HOUGHTON MIFFLIN HARCOURT
Publisher:
Houghton Mifflin Harcourt

College Algebra (MindTap Course List)
Algebra
ISBN:
9781305652231
Author:
R. David Gustafson, Jeff Hughes
Publisher:
Cengage Learning
Glencoe Algebra 1, Student Edition, 9780079039897…
Algebra
ISBN:
9780079039897
Author:
Carter
Publisher:
McGraw Hill
Big Ideas Math A Bridge To Success Algebra 1: Stu…
Algebra
ISBN:
9781680331141
Author:
HOUGHTON MIFFLIN HARCOURT
Publisher:
Houghton Mifflin Harcourt
College Algebra (MindTap Course List)
Algebra
ISBN:
9781305652231
Author:
R. David Gustafson, Jeff Hughes
Publisher:
Cengage Learning