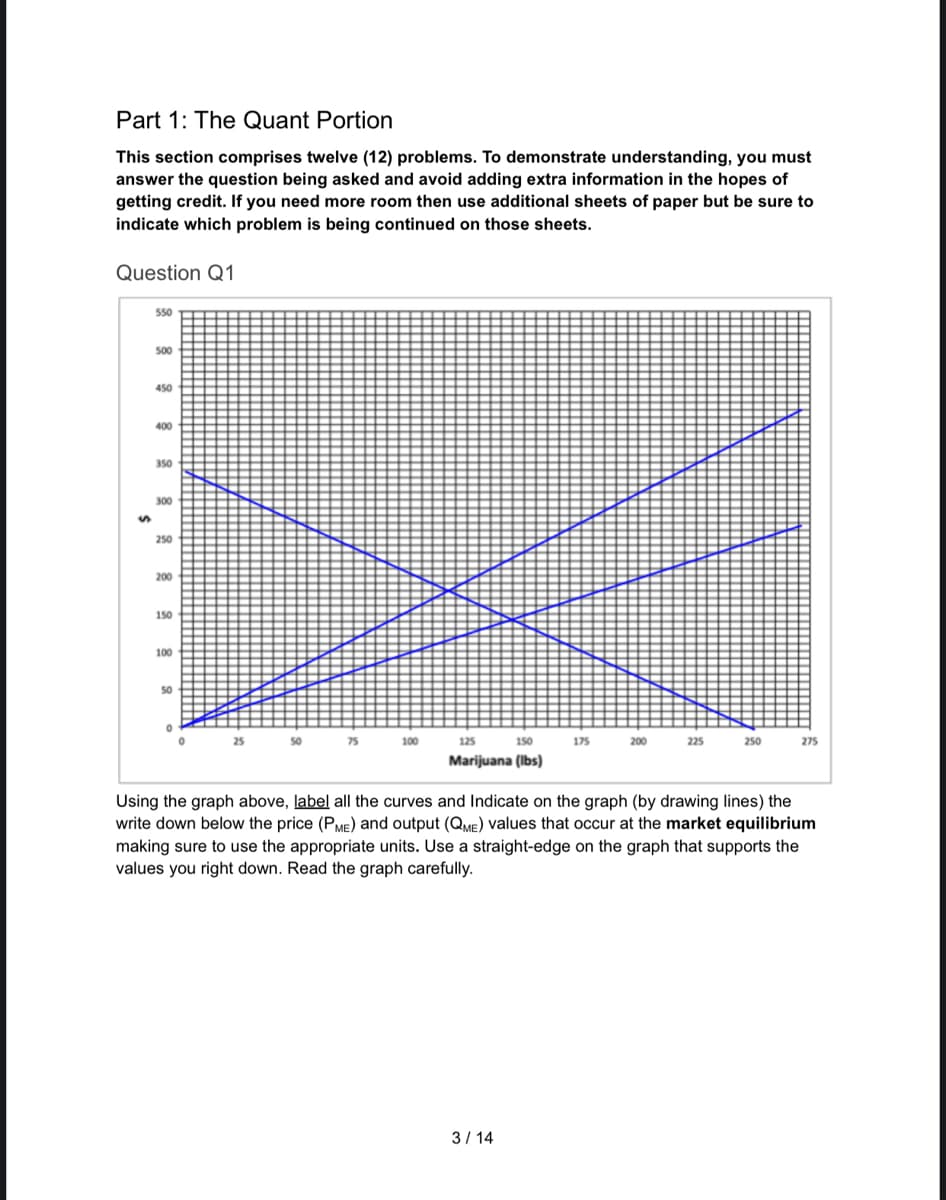
Part 1: The Quant Portion This section comprises twelve (12) problems. To demonstrate understanding, you must answer the question being asked and avoid adding extra information in the hopes of getting credit. If you need more room then use additional sheets of paper but be sure to indicate which problem is being continued on those sheets. Question Q1 s 550 500 450 400 350 300 250 200 150 100 50 75 100 125 150 Marijuana (lbs) 175 200 225 250 275 Using the graph above, label all the curves and Indicate on the graph (by drawing lines) the write down below the price (PME) and output (QME) values that occur at the market equilibrium making sure to use the appropriate units. Use a straight-edge on the graph that supports the values you right down. Read the graph carefully.
Part 1: The Quant Portion This section comprises twelve (12) problems. To demonstrate understanding, you must answer the question being asked and avoid adding extra information in the hopes of getting credit. If you need more room then use additional sheets of paper but be sure to indicate which problem is being continued on those sheets. Question Q1 s 550 500 450 400 350 300 250 200 150 100 50 75 100 125 150 Marijuana (lbs) 175 200 225 250 275 Using the graph above, label all the curves and Indicate on the graph (by drawing lines) the write down below the price (PME) and output (QME) values that occur at the market equilibrium making sure to use the appropriate units. Use a straight-edge on the graph that supports the values you right down. Read the graph carefully.

Economics Today and Tomorrow, Student Edition
1st Edition
ISBN:9780078747663
Author:McGraw-Hill
Publisher:McGraw-Hill
Chapter4: Going Into Debt
Section: Chapter Questions
Problem 2AA

Related questions
Question
3Q1: Use the following to complete graph.
Transcribed Image Text:Part 1: The Quant Portion
This section comprises twelve (12) problems. To demonstrate understanding, you must
answer the question being asked and avoid adding extra information in the hopes of
getting credit. If you need more room then use additional sheets of paper but be sure to
indicate which problem is being continued on those sheets.
Question Q1
550
500
450
400
350
300
250
200
150
100
50
125
150
Marijuana (lbs)
225
3/14
250
275
Using the graph above, label all the curves and Indicate on the graph (by drawing lines) the
write down below the price (PME) and output (QME) values that occur at the market equilibrium
making sure to use the appropriate units. Use a straight-edge on the graph that supports the
values you right down. Read the graph carefully.
Expert Solution
This question has been solved!
Explore an expertly crafted, step-by-step solution for a thorough understanding of key concepts.

Step by step
Solved in 3 steps with 1 images

Knowledge Booster


Learn more about
Need a deep-dive on the concept behind this application? Look no further. Learn more about this topic, economics and related others by exploring similar questions and additional content below.Recommended textbooks for you
Economics Today and Tomorrow, Student Edition
Economics
ISBN:
9780078747663
Author:
McGraw-Hill
Publisher:
Glencoe/McGraw-Hill School Pub Co

Economics: Private and Public Choice (MindTap Cou…
Economics
ISBN:
9781305506725
Author:
James D. Gwartney, Richard L. Stroup, Russell S. Sobel, David A. Macpherson
Publisher:
Cengage Learning

Microeconomics: Private and Public Choice (MindTa…
Economics
ISBN:
9781305506893
Author:
James D. Gwartney, Richard L. Stroup, Russell S. Sobel, David A. Macpherson
Publisher:
Cengage Learning
Economics Today and Tomorrow, Student Edition
Economics
ISBN:
9780078747663
Author:
McGraw-Hill
Publisher:
Glencoe/McGraw-Hill School Pub Co
Economics: Private and Public Choice (MindTap Cou…
Economics
ISBN:
9781305506725
Author:
James D. Gwartney, Richard L. Stroup, Russell S. Sobel, David A. Macpherson
Publisher:
Cengage Learning
Microeconomics: Private and Public Choice (MindTa…
Economics
ISBN:
9781305506893
Author:
James D. Gwartney, Richard L. Stroup, Russell S. Sobel, David A. Macpherson
Publisher:
Cengage Learning

Macroeconomics: Private and Public Choice (MindTa…
Economics
ISBN:
9781305506756
Author:
James D. Gwartney, Richard L. Stroup, Russell S. Sobel, David A. Macpherson
Publisher:
Cengage Learning