Part A The following data show the rate constant of a reaction measured at several different temperatures. Use an Arrhenius plot to determine the activation barrier for the reaction. Temperature (K) Rate Constant (s-) Express your answer using three significant figures. 300 5.73x10⁻³ 310 1.82x10⁻² Jemplates Symbols uado redo resat keyboard shortcuts help 320 5.40x10⁻² 330 0.150 Ea = kJ/mol 340 0.391 Submit Request Answer • Part B Use an Arrhenius plot to determine frequency factor for the reaction. Express your answer using two significant figures. Templates Symbols uado redo reset keyboard shortcuts help A =
Part A The following data show the rate constant of a reaction measured at several different temperatures. Use an Arrhenius plot to determine the activation barrier for the reaction. Temperature (K) Rate Constant (s-) Express your answer using three significant figures. 300 5.73x10⁻³ 310 1.82x10⁻² Jemplates Symbols uado redo resat keyboard shortcuts help 320 5.40x10⁻² 330 0.150 Ea = kJ/mol 340 0.391 Submit Request Answer • Part B Use an Arrhenius plot to determine frequency factor for the reaction. Express your answer using two significant figures. Templates Symbols uado redo reset keyboard shortcuts help A =

Chemistry for Engineering Students
4th Edition
ISBN:9781337398909
Author:Lawrence S. Brown, Tom Holme
Publisher:Lawrence S. Brown, Tom Holme
Chapter11: Chemical Kinetics
Section: Chapter Questions
Problem 11.20PAE: Experimental data are listed here for the reaction B: Time (s) IB] (mol/L) 0.00 0.000 10.0 0.326...

Related questions
Question
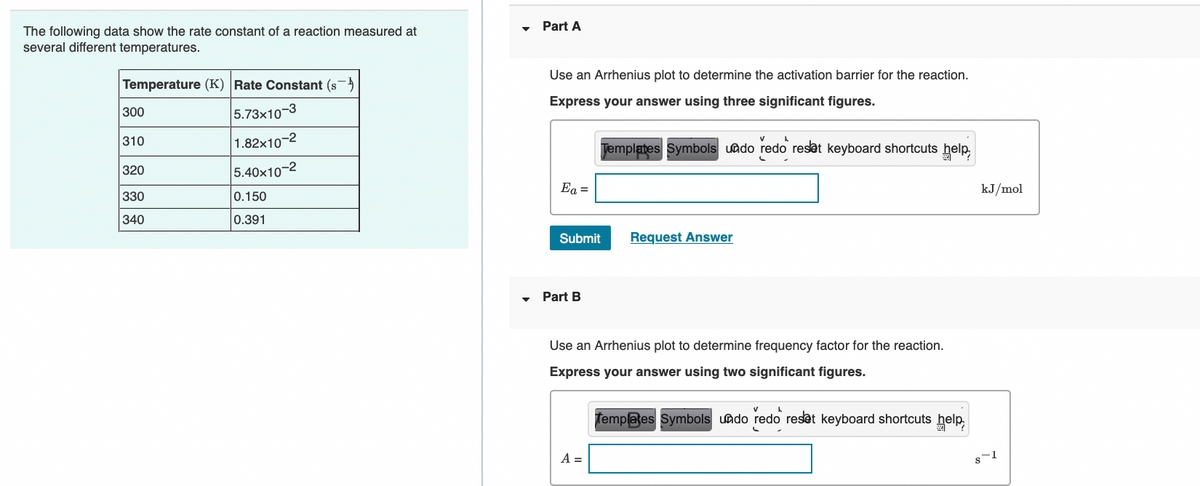
Transcribed Image Text:Part A
The following data show the rate constant of a reaction measured at
several different temperatures.
Use an Arrhenius plot to determine the activation barrier for the reaction.
Temperature (K) Rate Constant (s)
Express your answer using three significant figures.
300
5.73x10⁻³
310
1.82x10⁻²
Jemplates Symbols uado redo resat keyboard shortcuts help,
320
|5.40x10⁻²
Ea =
kJ/mol
330
0.150
340
0.391
Submit
Request Answer
Part B
Use an Arrhenius plot to determine frequency factor for the reaction.
Express your answer using two significant figures.
Templaes Symbols uado redo resat keyboard shortcuts help,
A =
Expert Solution
This question has been solved!
Explore an expertly crafted, step-by-step solution for a thorough understanding of key concepts.

This is a popular solution!

Trending now
This is a popular solution!

Step by step
Solved in 3 steps with 2 images

Knowledge Booster


Learn more about
Need a deep-dive on the concept behind this application? Look no further. Learn more about this topic, chemistry and related others by exploring similar questions and additional content below.Recommended textbooks for you
Chemistry for Engineering Students
Chemistry
ISBN:
9781337398909
Author:
Lawrence S. Brown, Tom Holme
Publisher:
Cengage Learning

Chemistry by OpenStax (2015-05-04)
Chemistry
ISBN:
9781938168390
Author:
Klaus Theopold, Richard H Langley, Paul Flowers, William R. Robinson, Mark Blaser
Publisher:
OpenStax

Chemistry: An Atoms First Approach
Chemistry
ISBN:
9781305079243
Author:
Steven S. Zumdahl, Susan A. Zumdahl
Publisher:
Cengage Learning
Chemistry for Engineering Students
Chemistry
ISBN:
9781337398909
Author:
Lawrence S. Brown, Tom Holme
Publisher:
Cengage Learning
Chemistry by OpenStax (2015-05-04)
Chemistry
ISBN:
9781938168390
Author:
Klaus Theopold, Richard H Langley, Paul Flowers, William R. Robinson, Mark Blaser
Publisher:
OpenStax
Chemistry: An Atoms First Approach
Chemistry
ISBN:
9781305079243
Author:
Steven S. Zumdahl, Susan A. Zumdahl
Publisher:
Cengage Learning

Chemistry
Chemistry
ISBN:
9781305957404
Author:
Steven S. Zumdahl, Susan A. Zumdahl, Donald J. DeCoste
Publisher:
Cengage Learning


Chemistry: Principles and Reactions
Chemistry
ISBN:
9781305079373
Author:
William L. Masterton, Cecile N. Hurley
Publisher:
Cengage Learning