
Chapter6: Tracking The U.s. Economy
Section: Chapter Questions
Problem 3.7P

Related questions
Question
Part C please.
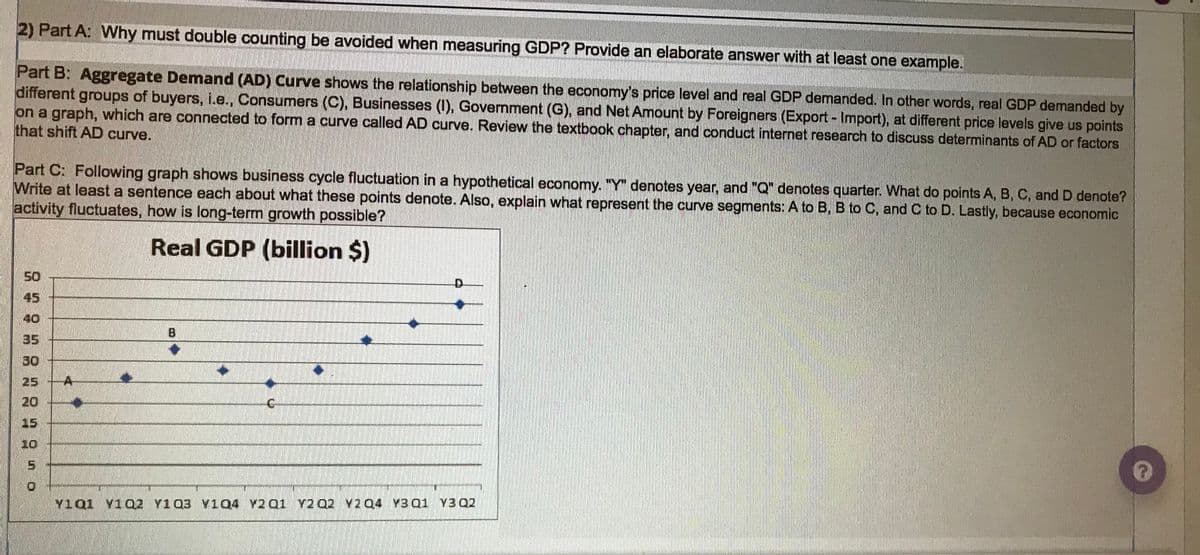
Transcribed Image Text:2) Part A: Why must double counting be avoided when measuring GDP? Provide an elaborate answer with at least one example.
Part B: Aggregate Demand (AD) Curve shows the relationship between the economy's price level and real GDP demanded. In other words, real GDP demanded by
different groups of buyers, i.e., Consumers (C), Businesses (1), Government (G), and Net Amount by Foreigners (Export - Import), at different price levels give us points
on a graph, which are connected to form a curve called AD curve. Review the textbook chapter, and conduct internet research to discuss determinants of AD or factors
that shift AD curve.
Part C: Following graph shows business cycle fluctuation in a hypothetical economy. "Y" denotes year, and "Q" denotes quarter. What do points A, B, C, andD denote?
Write at least a sentence each about what these points denote. Also, explain what represent the curve segments: A to B, B to C, and C to D. Lastly, because economic
activity fluctuates, how is long-term growth possible?
Real GDP (billion $)
50
45
40
B
35
30
25
20
15
10
Y1Q1 Y1Q2 Y103 Y1Q4 Y2 Q1 Y2 Q2 Y2 Q4 Y3 Q1 Y3 Q2
Expert Solution
This question has been solved!
Explore an expertly crafted, step-by-step solution for a thorough understanding of key concepts.

This is a popular solution!

Trending now
This is a popular solution!

Step by step
Solved in 3 steps

Knowledge Booster


Learn more about
Need a deep-dive on the concept behind this application? Look no further. Learn more about this topic, economics and related others by exploring similar questions and additional content below.Recommended textbooks for you

Essentials of Economics (MindTap Course List)
Economics
ISBN:
9781337091992
Author:
N. Gregory Mankiw
Publisher:
Cengage Learning

Brief Principles of Macroeconomics (MindTap Cours…
Economics
ISBN:
9781337091985
Author:
N. Gregory Mankiw
Publisher:
Cengage Learning
Essentials of Economics (MindTap Course List)
Economics
ISBN:
9781337091992
Author:
N. Gregory Mankiw
Publisher:
Cengage Learning
Brief Principles of Macroeconomics (MindTap Cours…
Economics
ISBN:
9781337091985
Author:
N. Gregory Mankiw
Publisher:
Cengage Learning