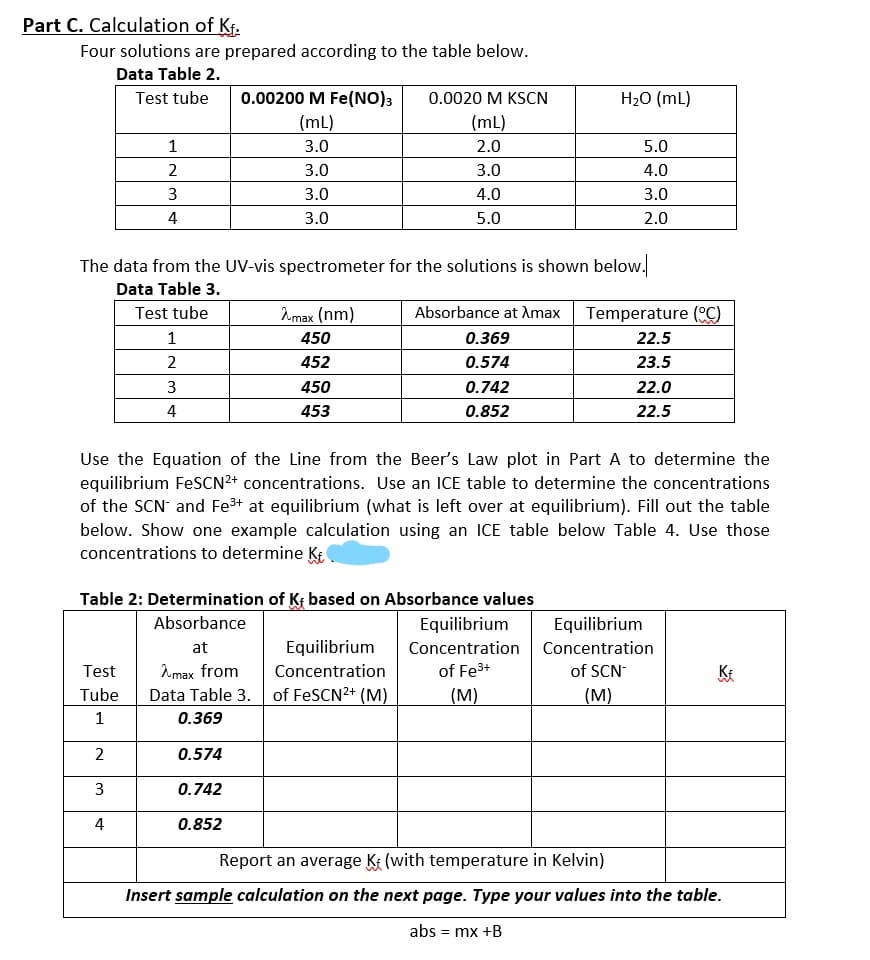
Part C. Calculation of Kf. Four solutions are prepared according to the table below. Data Table 2. Test tube 0.00200 M Fe(NO)3 0.0020 M KSCN H20 (mL) (mL) (mL) 1 3.0 2.0 5.0 2 3.0 3.0 4.0 3.0 4.0 3.0 4 3.0 5.0 2.0 The data from the UV-vis spectrometer for the solutions is shown below.
Part C. Calculation of Kf. Four solutions are prepared according to the table below. Data Table 2. Test tube 0.00200 M Fe(NO)3 0.0020 M KSCN H20 (mL) (mL) (mL) 1 3.0 2.0 5.0 2 3.0 3.0 4.0 3.0 4.0 3.0 4 3.0 5.0 2.0 The data from the UV-vis spectrometer for the solutions is shown below.

Chapter28: Atomic Spectroscopy
Section: Chapter Questions
Problem 28.2QAP

Related questions
Question
100%
Solve for the entire table 2
show all work typed.
Double-check your answers.
Transcribed Image Text:Part C. Calculation of Kf.
Four solutions are prepared according to the table below.
Data Table 2.
Test tube
0.00200 M Fe(NO)3
0.0020 M KSCN
H20 (mL)
(mL)
(mL)
1
3.0
2.0
5.0
2
3.0
3.0
4.0
3
3.0
4.0
3.0
4
3.0
5.0
2.0
The data from the UV-vis spectrometer for the solutions is shown below.
Data Table 3.
Test tube
Amax (nm)
Absorbance at Amax
Temperature (C)
1
450
0.369
22.5
2
452
0.574
23.5
3
450
0.742
22.0
4
453
0.852
22.5
Use the Equation of the Line from the Beer's Law plot in Part A to determine the
equilibrium FesCN2+ concentrations. Use an ICE table to determine the concentrations
of the SCN and Fe3+ at equilibrium (what is left over at equilibrium). Fill out the table
below. Show one example calculation using an ICE table below Table 4. Use those
concentrations to determine K
Table 2: Determination of Kr based on Absorbance values
Absorbance
Equilibrium
Equilibrium
at
Equilibrium
Concentration Concentration
of SCN
(M)
Test
Amax from
Concentration
of Fe3+
KE
Tube
Data Table 3.
of FESCN2+ (M)
(М)
0.369
2
0.574
3
0.742
4
0.852
Report an average Ke (with temperature in Kelvin)
Insert sample calculation on the next page. Type your values into the table.
abs = mx +B
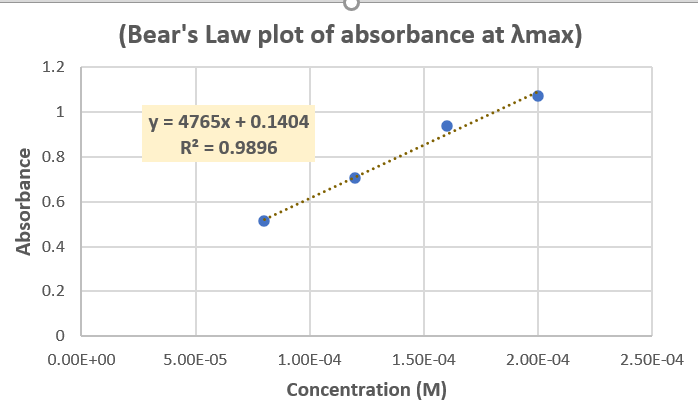
Transcribed Image Text:(Bear's Law plot of absorbance at Amax)
1.2
y = 4765x + 0.1404
R? = 0.9896
0.8
0.6
0.4
0.2
0.00E+00
5.00E-05
1.00E-04
1.50E-04
2.00E-04
2.50E-04
Concentration (M)
Absorbance
Expert Solution
This question has been solved!
Explore an expertly crafted, step-by-step solution for a thorough understanding of key concepts.
Step 1
VIEWDetermining the equilibrium concentration of Fe(SCN)2+
VIEWCalculating the initial concentration of Fe3+ in the prepared solutions
VIEWCalculating the initial concentration of SCN- in the prepared solutions
VIEWSetting up the ICE table and calculating Kf for test tube 1
VIEWSetting up the ICE table and calculating Kf for test tube 2
VIEWSetting up the ICE table and calculating Kf for test tube 3
VIEWSetting up the ICE table and calculating Kf for test tube 4
VIEWStep 9
VIEWStep 10
VIEW
Step by step
Solved in 10 steps with 1 images

Knowledge Booster


Learn more about
Need a deep-dive on the concept behind this application? Look no further. Learn more about this topic, chemistry and related others by exploring similar questions and additional content below.Recommended textbooks for you