Past records suggest that the mean annual income, u, of teachers in state of New York is less than or equal to the mean annual income, u, of teachers in Illinois. In a current study, a random sample of 15 teachers from New York and an independent random sample of 15 teachers from Illinois have been asked to report their mean annual income. The data obtained are as follows: Annual income in dollars New York 46406, 43039, 47083, 47056, 46810, 47074, 43524, 59524, 49763, 48083, 46100, 53904, 43171, 44341, 52229 Illinois 53010, 43485, 39037, 47622, 47151, 50372, 41401, 35007, 40591, 49268, 44782, 39668, 52555, 49976, 49207 The population standard deviation for mean annual income of teachers in New York and in Illinois are estimated as 6600 and 6200, respectively. It is also known that both populations are approximately normally distributed. At the 0.01 level of significance, is there sufficient evidence to reject the claim that the mean annual income of teachers in state of New York is less than or equal to the mean annual income of teachers in Illinois? Perform a one-tailed test. Then fill in the table below. Carry your intermediate computations to at least three decimal places and round your answers as specified in the table. (If necessary, consult a list of formulas.) The null hypothesis: H : ul < µ2 The alternative hypothesis: H : ul > µ2 O=0 OSO O20 The type of test statistic: olo
Past records suggest that the mean annual income, u, of teachers in state of New York is less than or equal to the mean annual income, u, of teachers in Illinois. In a current study, a random sample of 15 teachers from New York and an independent random sample of 15 teachers from Illinois have been asked to report their mean annual income. The data obtained are as follows: Annual income in dollars New York 46406, 43039, 47083, 47056, 46810, 47074, 43524, 59524, 49763, 48083, 46100, 53904, 43171, 44341, 52229 Illinois 53010, 43485, 39037, 47622, 47151, 50372, 41401, 35007, 40591, 49268, 44782, 39668, 52555, 49976, 49207 The population standard deviation for mean annual income of teachers in New York and in Illinois are estimated as 6600 and 6200, respectively. It is also known that both populations are approximately normally distributed. At the 0.01 level of significance, is there sufficient evidence to reject the claim that the mean annual income of teachers in state of New York is less than or equal to the mean annual income of teachers in Illinois? Perform a one-tailed test. Then fill in the table below. Carry your intermediate computations to at least three decimal places and round your answers as specified in the table. (If necessary, consult a list of formulas.) The null hypothesis: H : ul < µ2 The alternative hypothesis: H : ul > µ2 O=0 OSO O20 The type of test statistic: olo

Glencoe Algebra 1, Student Edition, 9780079039897, 0079039898, 2018
18th Edition
ISBN:9780079039897
Author:Carter
Publisher:Carter
Chapter10: Statistics
Section10.5: Comparing Sets Of Data
Problem 13PPS

Related questions
Topic Video
Question
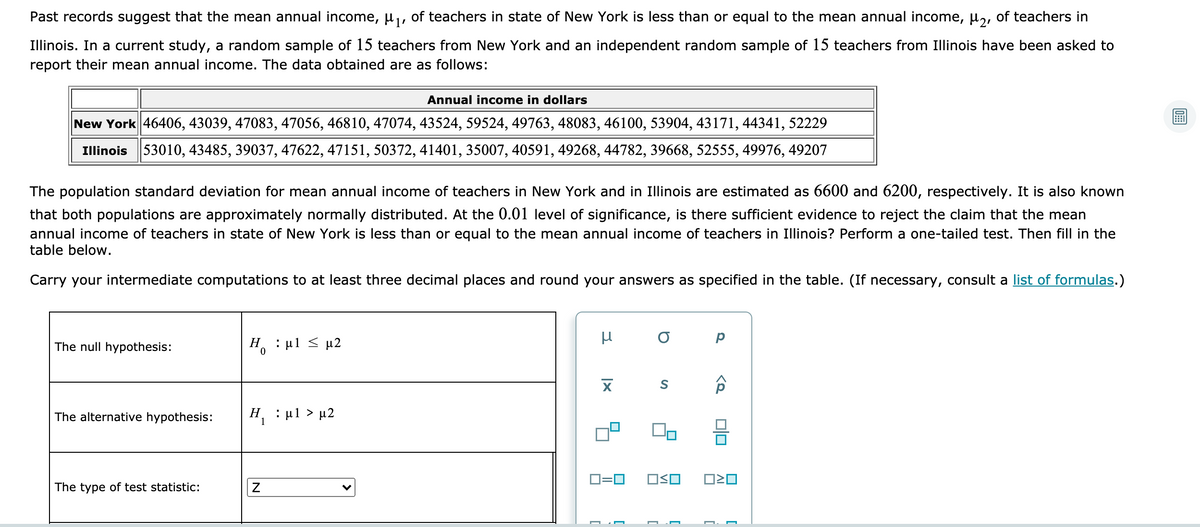
Transcribed Image Text:Past records suggest that the mean annual income, µ,, of teachers in state of New York is less than or equal to the mean annual income, µ,, of teachers in
Illinois. In a current study, a random sample of 15 teachers from New York and an independent random sample of 15 teachers from Illinois have been asked to
report their mean annual income. The data obtained are as follows:
Annual income in dollars
New York 46406, 43039, 47083, 47056, 46810, 47074, 43524, 59524, 49763, 48083, 46100, 53904, 43171, 44341, 52229
Illinois 53010, 43485, 39037, 47622, 47151, 50372, 41401, 35007, 40591, 49268, 44782, 39668, 52555, 49976, 49207
The population standard deviation for mean annual income of teachers in New York and in Illinois are estimated as 6600 and 6200, respectively. It is also known
that both populations are approximately normally distributed. At the 0.01 level of significance, is there sufficient evidence to reject the claim that the mean
annual income of teachers in state of New York is less than or equal to the mean annual income of teachers in Illinois? Perform a one-tailed test. Then fill in the
table below.
Carry your intermediate computations to at least three decimal places and round your answers as specified in the table. (If necessary, consult a list of formulas.)
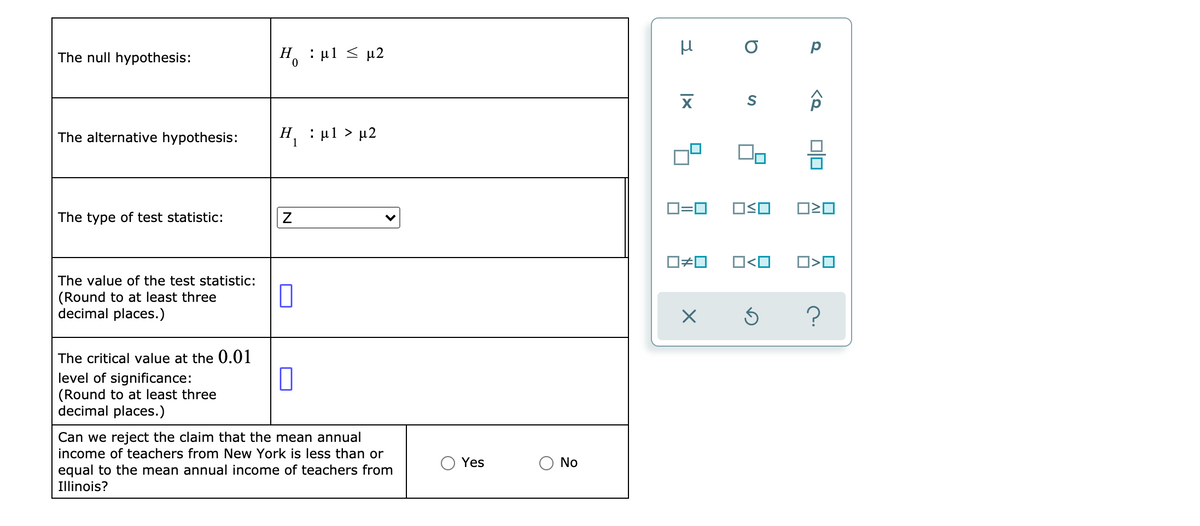
The null hypothesis:
Η, : μ1 μ2
The alternative hypothesis:
H : ul > µ2
1
D=0
OSO
The type of test statistic:
미□
[
Transcribed Image Text:Η, : μ1 μ2
O p
The null hypothesis:
The alternative hypothesis:
H : ul > µ2
Н.
1
O=0
OSO
The type of test statistic:
O#0
O<O
The value of the test statistic:
(Round to at least three
decimal places.)
The critical value at the 0.01
level of significance:
(Round to at least three
decimal places.)
Can we reject the claim that the mean annual
income of teachers from New York is less than or
Yes
No
equal to the mean annual income of teachers from
Illinois?
Expert Solution
This question has been solved!
Explore an expertly crafted, step-by-step solution for a thorough understanding of key concepts.

This is a popular solution!

Trending now
This is a popular solution!

Step by step
Solved in 2 steps with 8 images

Knowledge Booster


Learn more about
Need a deep-dive on the concept behind this application? Look no further. Learn more about this topic, statistics and related others by exploring similar questions and additional content below.Recommended textbooks for you
Glencoe Algebra 1, Student Edition, 9780079039897…
Algebra
ISBN:
9780079039897
Author:
Carter
Publisher:
McGraw Hill
Glencoe Algebra 1, Student Edition, 9780079039897…
Algebra
ISBN:
9780079039897
Author:
Carter
Publisher:
McGraw Hill