PATTERN S OF INT ERNATIO NAL TRADE 122 PART 2 Export ($ billions) lo Import 8($ billions) Product HTS Level 19.2 6.4 22 Beverages 64.1 38.0 30 Pharmaceutical products 8.2 1.1 52 Cotton 1.4 41.1 61 Apparel 64 Footwear 0.8 23.7 72 Iron and steel 22.0 29.0 10.2 Copper Electric machinery 74 9.3 85 105.0 289.0 87 Vehicles 122.3 240.0 88 Aircraft 95.8 24.2 94 Furniture 8.7 44.3 95 Toys 4.4 27.0 Source: International Trade Administration, U.S. Department of Commerce. 10. Following are data for soybean yield, produc- tion, and trade for 2010–2011: a. In which countries does land b free trade in soybeans? Explai Suppose that the countries listed in b. In
PATTERN S OF INT ERNATIO NAL TRADE 122 PART 2 Export ($ billions) lo Import 8($ billions) Product HTS Level 19.2 6.4 22 Beverages 64.1 38.0 30 Pharmaceutical products 8.2 1.1 52 Cotton 1.4 41.1 61 Apparel 64 Footwear 0.8 23.7 72 Iron and steel 22.0 29.0 10.2 Copper Electric machinery 74 9.3 85 105.0 289.0 87 Vehicles 122.3 240.0 88 Aircraft 95.8 24.2 94 Furniture 8.7 44.3 95 Toys 4.4 27.0 Source: International Trade Administration, U.S. Department of Commerce. 10. Following are data for soybean yield, produc- tion, and trade for 2010–2011: a. In which countries does land b free trade in soybeans? Explai Suppose that the countries listed in b. In

Principles of Economics 2e
2nd Edition
ISBN:9781947172364
Author:Steven A. Greenlaw; David Shapiro
Publisher:Steven A. Greenlaw; David Shapiro
Chapter22: Inflation
Section: Chapter Questions
Problem 4SCQ: Edna is living in a retirement home where home where most of her needs are taken care of, but she...

Related questions
Question
The following are data on U.S. exports and imports in 2012 at the two-digit Harmonized Tariff Schedule (HTS) level. Which products do you think support the Heckscher-Ohlin theorem? Which products are inconsistent?
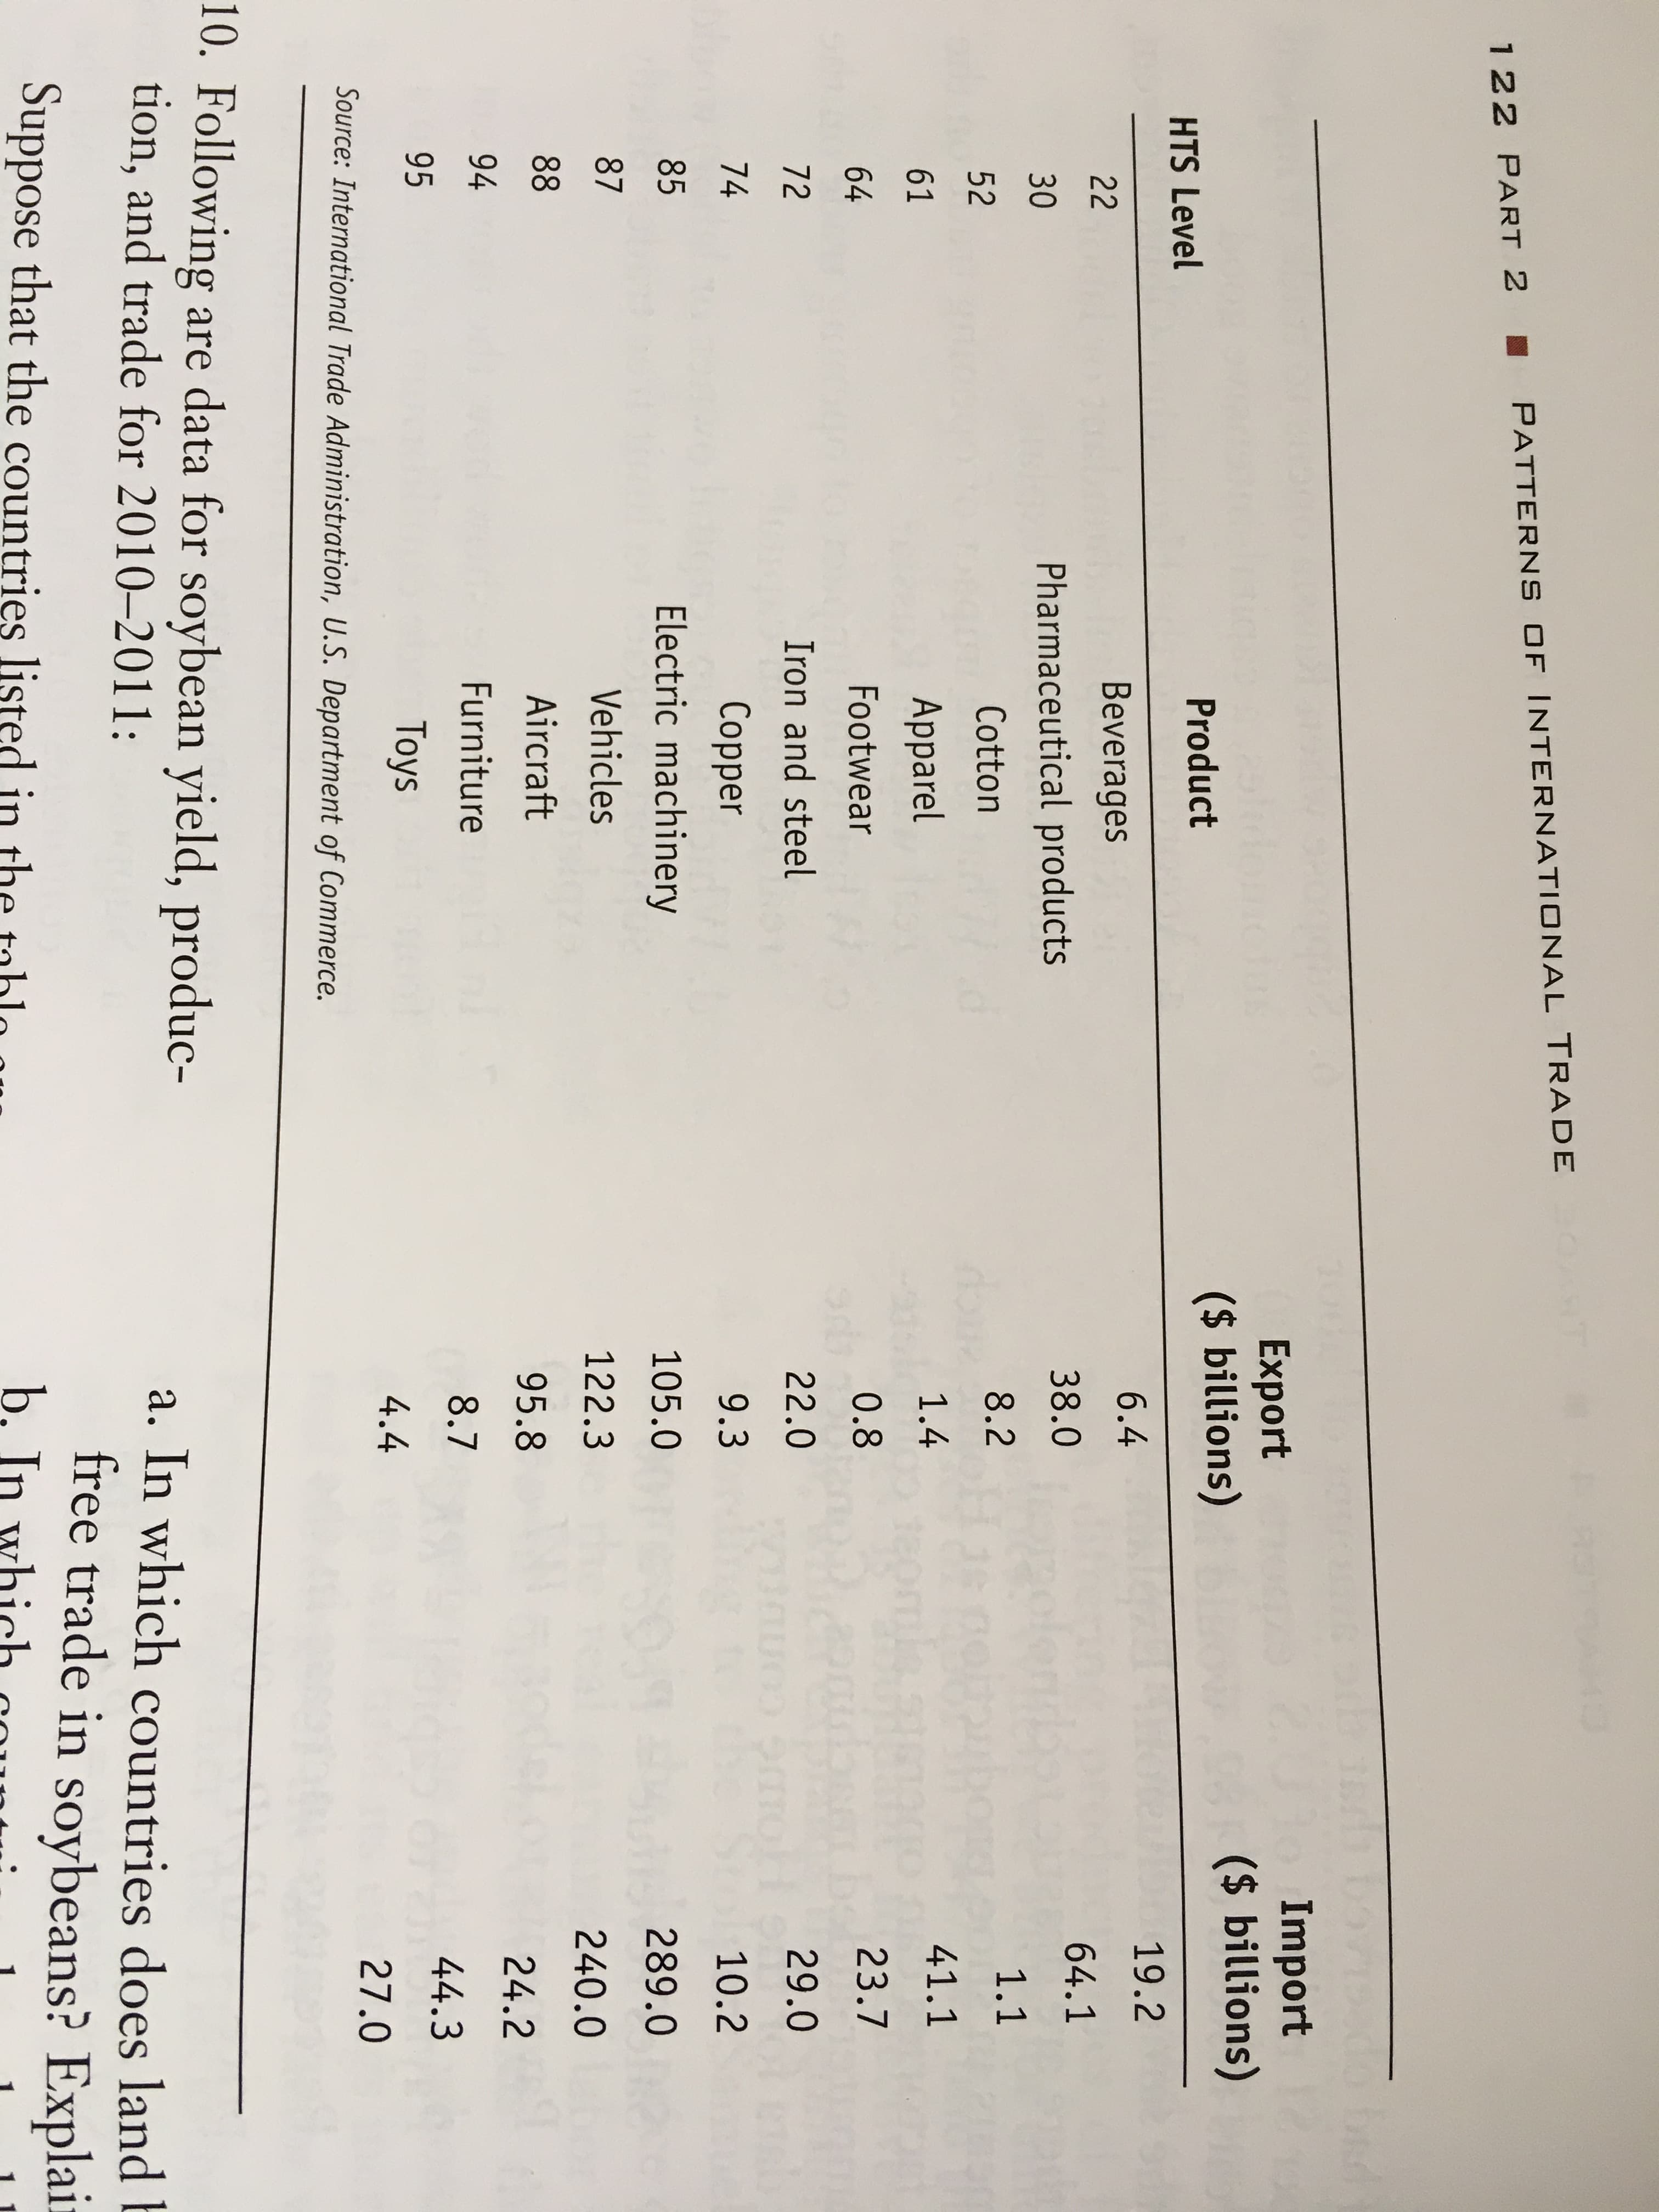
Transcribed Image Text:PATTERN S OF INT ERNATIO NAL TRADE
122 PART 2
Export
($ billions)
lo Import
8($ billions)
Product
HTS Level
19.2
6.4
22
Beverages
64.1
38.0
30
Pharmaceutical products
8.2
1.1
52
Cotton
1.4
41.1
61
Apparel
64
Footwear
0.8
23.7
72
Iron and steel
22.0
29.0
10.2
Copper
Electric machinery
74
9.3
85
105.0
289.0
87
Vehicles
122.3
240.0
88
Aircraft
95.8
24.2
94
Furniture
8.7
44.3
95
Toys
4.4
27.0
Source: International Trade Administration, U.S. Department of Commerce.
10. Following are data for soybean yield, produc-
tion, and trade for 2010–2011:
a. In which countries does land b
free trade in soybeans? Explai
Suppose that the countries listed in
b. In
Expert Solution
This question has been solved!
Explore an expertly crafted, step-by-step solution for a thorough understanding of key concepts.

This is a popular solution!

Trending now
This is a popular solution!

Step by step
Solved in 2 steps

Knowledge Booster


Learn more about
Need a deep-dive on the concept behind this application? Look no further. Learn more about this topic, economics and related others by exploring similar questions and additional content below.Recommended textbooks for you
Principles of Economics 2e
Economics
ISBN:
9781947172364
Author:
Steven A. Greenlaw; David Shapiro
Publisher:
OpenStax


Principles of Economics 2e
Economics
ISBN:
9781947172364
Author:
Steven A. Greenlaw; David Shapiro
Publisher:
OpenStax