

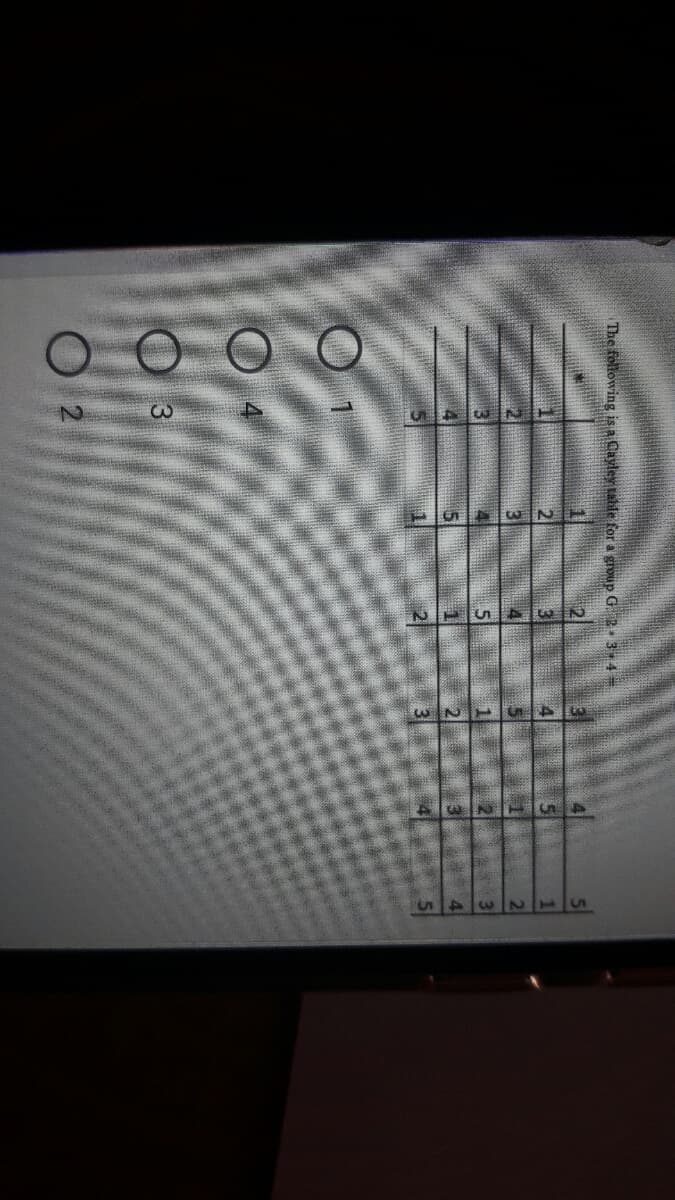
Q: Please see question attached.
A: From given data, Total no of people= 118752 No of persons who are male and age is between 25-34 is…
Q: In two towns A and B, the following information was supplied by an investigator Total population (in…
A:
Q: The following table gives the mean and S.D. for two groups X and Y. Find the Combined S.D. of these…
A: Introduction WehWe given the mean and Standard Deviation for two groups X and Y. We have to find the…
Q: The ranks of two different groups are given below. Calculate the rank correlation. RI R2 2 5 3 3
A: Obtain the value of the spearman’s rank correlation coefficient. The value of the spearman’s rank…
Q: Determine the number of classes in the frequency table below. Class Frequency 3-4 7 5-6 2 7-8 6.…
A: In the above example the number of classes are 5 .
Q: Consider the following data coming from a study of three different groups. and fill in the missing…
A: A. The total for group 2 is, T=1+4+5+2=12 Thus, the value of T is 12. B. The sample size for group 2…
Q: Use the following Informatlon for Questlons 2-6 The table below organizes the people who were…
A: Probability = number of favourable outcome / Total number of outcomes
Q: Exhibit 15-3 Pertain to the following data. group1 group2 group3 4 11…
A: Preliminary calculation:Here, number of groups, m is 3Number of samples in each group, n is…
Q: A survey of 500 people were asked this same question and the results were recorded in a tree diagram…
A: As per our guidelines we are supposed to answer only 3 subpart of any questions so i am solving…
Q: 5. The following table shows the average annual amount of precipitation (mm) for 16 Canadian cities.…
A: From the given information data of cities precipitation(mm) is…
Q: Example 15.3 Given the following data. Find whether A and B are independent or associated. n. = 150,…
A:
Q: r2r2 = (Round to two decimal places) Interpret r2r2 :
A: Answer: For the given data,
Q: 10. One hundred students were surveyed and asked if they are currently taking math (M), English (E)…
A:
Q: The cumulative frequency of the group data set Frequency Class 50-70 10 70-90 15 90-110 60, 80, 100…
A: From the provided information, Frequency Class 5 50-70 10 70-90 15 90-110
Q: The following tables show the make-up of students in a school's math club. Male Female Totals…
A:
Q: The following are the group index numbers and the group weights of an average working class family's…
A:
Q: *39. Public Programs. During one year, the College of Public Pro- grams at a major university…
A: Solution
Q: 1 Given below are the figures of production of a factory: Year: 1992 1993 1994 1995 1996 1997…
A:
Q: The following table is frequency distribution for the color of 40 cars in the parking GREEN WHITE…
A:
Q: 3. The following boxplots display data on lightbulb lifetimes for three brands (A, B, and C).
A: HERE GIVEN BOXPLOTS OF THE THREE BRANDS A,B,C OF LIGHTBULBS. NOTE-AS PER POLICY I HAVE…
Q: Illustration 21.18. Following two tables give the condition of home and condition of child in a…
A:
Q: 2) The following Bar graph shows the mathematics test scores for eight students: 120 100 96.00 92.00…
A:
Q: Find the missing information from the following : Group II 150 (N2) Group III 250 ( N3) Combined…
A:
Q: There are 80 people in a building. • 9 of them have black and white hair • 35 have black hair only •…
A:
Q: 9. If n = 30 for one group and n = 32 for another group, what is the value of df for a t test on…
A: 9. The formula for the degrees of freedom is, df=n1+n2-2
Q: Use JMP to create a barplot from the following Frequency Table 5 7 9 11 13 15 17 19 4 6 13 10 75 3 2
A: Note: Hi there! Thank you for posting the question. As you have posted multiple questions, as per…
Q: Given group data: Gp 1 12. f. 1 20 30 7 30 40 9. Find: Q1 3 40 50 12 4 50 60 15 5 60 70 6.70 80 4 LO
A: Solution: Class Frequencyf cf 20 - 30 7 7 30 - 40 9 16 40 - 50 12 28 50 - 60 15 43 60 -…
Q: 5. The following dotplot shows the migraine intensity (on a scale of 1 to 10) for 29 adults…
A: We need to write the data from the dot diagram. 7,7,7,8,8,8,8,8,8,9,9,9,9,9,…
Q: Given the following table, calculate the frequencies of the remaining classes :- (AB) = 30 (N) (A) =…
A:
Q: In a survey of employees at a fast food restaurant, it was determined that 10 cooked food, 11 washed…
A:
Q: Flying Start Machine 200 m- Race World Record Times The following data chart shows the world record…
A: Since you have posted a question with multiple sub-parts, we will solve first 3 sub-parts for you.…
Q: In experimental design, what do you call the group that is not exposed to treatment? experimental…
A: In experimental design what do you call the group that is not exposed to treatment? Answer Control…
Q: I've tried all the methods I know, but still can't figure this out. Maybe I'm overthinking it, but…
A:
Q: Use the followlng Informatlon for Questlons 2-6 The table below organizes the people who were…
A: Percentage is a number which is expressed as a fraction of 100. The percentage is denoted by the…
Q: 1. The following are final score grades. Fill in the frequencies: Score 4 3 3 1 3 4 55 2 3 4 3 4 3 4…
A: Note: As per my policy i can answer only one question. kindly repost the remaining questions 1)…
Q: Referring to Table 1, the within groups degrees of freedom is 1) 4. 2) 3. 3) 16. 4) 19.
A: Anova is used to measure the mean significance between the three or more groups. It explains the…
Q: The values of the empty cells (numbered: 1,2,3,4, in red color), :respectively, are Source of…
A: Given: Source of Variation SS df MS F Between Groups 321.3325 Within Groups 24…
Q: Ages of 12 faculty members in the College of Arts and Sciences department of a certain University.…
A:
Q: The following table gives information on the amount (in dollars) Of the electric bills for a samle…
A:
Q: The table below gives the number of suicides estimated in the U.S. for a recent year by age, race…
A: Plot the cross-sectional table as follows: It is observed that there is a positive relation between…
Q: + 10 11 12 13 15 14 data 16 17 18 19 Based on the boxplot above, identify the 5 number summary
A:
Q: Example 51. Compute D; of the following data: 15 18 21 20
A: Data given 13,14,7,12,9,17,8,10,6,15,18,21,20
Q: The table below gives the number of suicides estimated in the U.S. for a recent year by age, race…
A: (d) Obtain the probability that a randomly selected individual was black. The probability that a…
Q: A survey of 100 college students who frequent the reading lounge of a university revealed the…
A:
Q: Use the following to answer questions 4-8 A review of voter registration records in a small town…
A:
Q: The following tables show the make-up of students in a school's math club. Male Female Totals…
A:
Q: Use the followlng Informatlon for Questlons 2-6 The table below organizes the people who were…
A: Solution. To find the percentage we first find the number of people in AYR .
Q: The two-way frequency table below shows the current inventory of lumber in a lumberyard. Suppose a…
A: We have to find out given probabiity..
Q: Question 2 A car loans officer of a large commercial bank wishes to determine whether the amount of…
A: Hi! Thank you for the question, As per the honor code, we are allowed to answer three sub-parts at a…
Q: 12 13 14 15 16 data 17 18 19 20 Based on the boxplot above, identify the 5 number summary
A: Given, Min =12 Q1=13 Q2=18 Q3=19 Max =20

Step by step
Solved in 2 steps


- Find the order of each of the following elements in the multiplicative group of units . for for for forFind the right regular representation of G as defined Exercise 11 for each of the following groups. a. G={ 1,i,1,i } from Example 1. b. The octic group D4={ e,,2,3,,,, }.If a is an element of order m in a group G and ak=e, prove that m divides k.