9. If n = 30 for one group and n = 32 for another group, what is the value of df for a t test on independent data?
9. If n = 30 for one group and n = 32 for another group, what is the value of df for a t test on independent data?

MATLAB: An Introduction with Applications
6th Edition
ISBN:9781119256830
Author:Amos Gilat
Publisher:Amos Gilat
Chapter1: Starting With Matlab
Section: Chapter Questions
Problem 1P

Related questions
Question
100%
question 9 please.
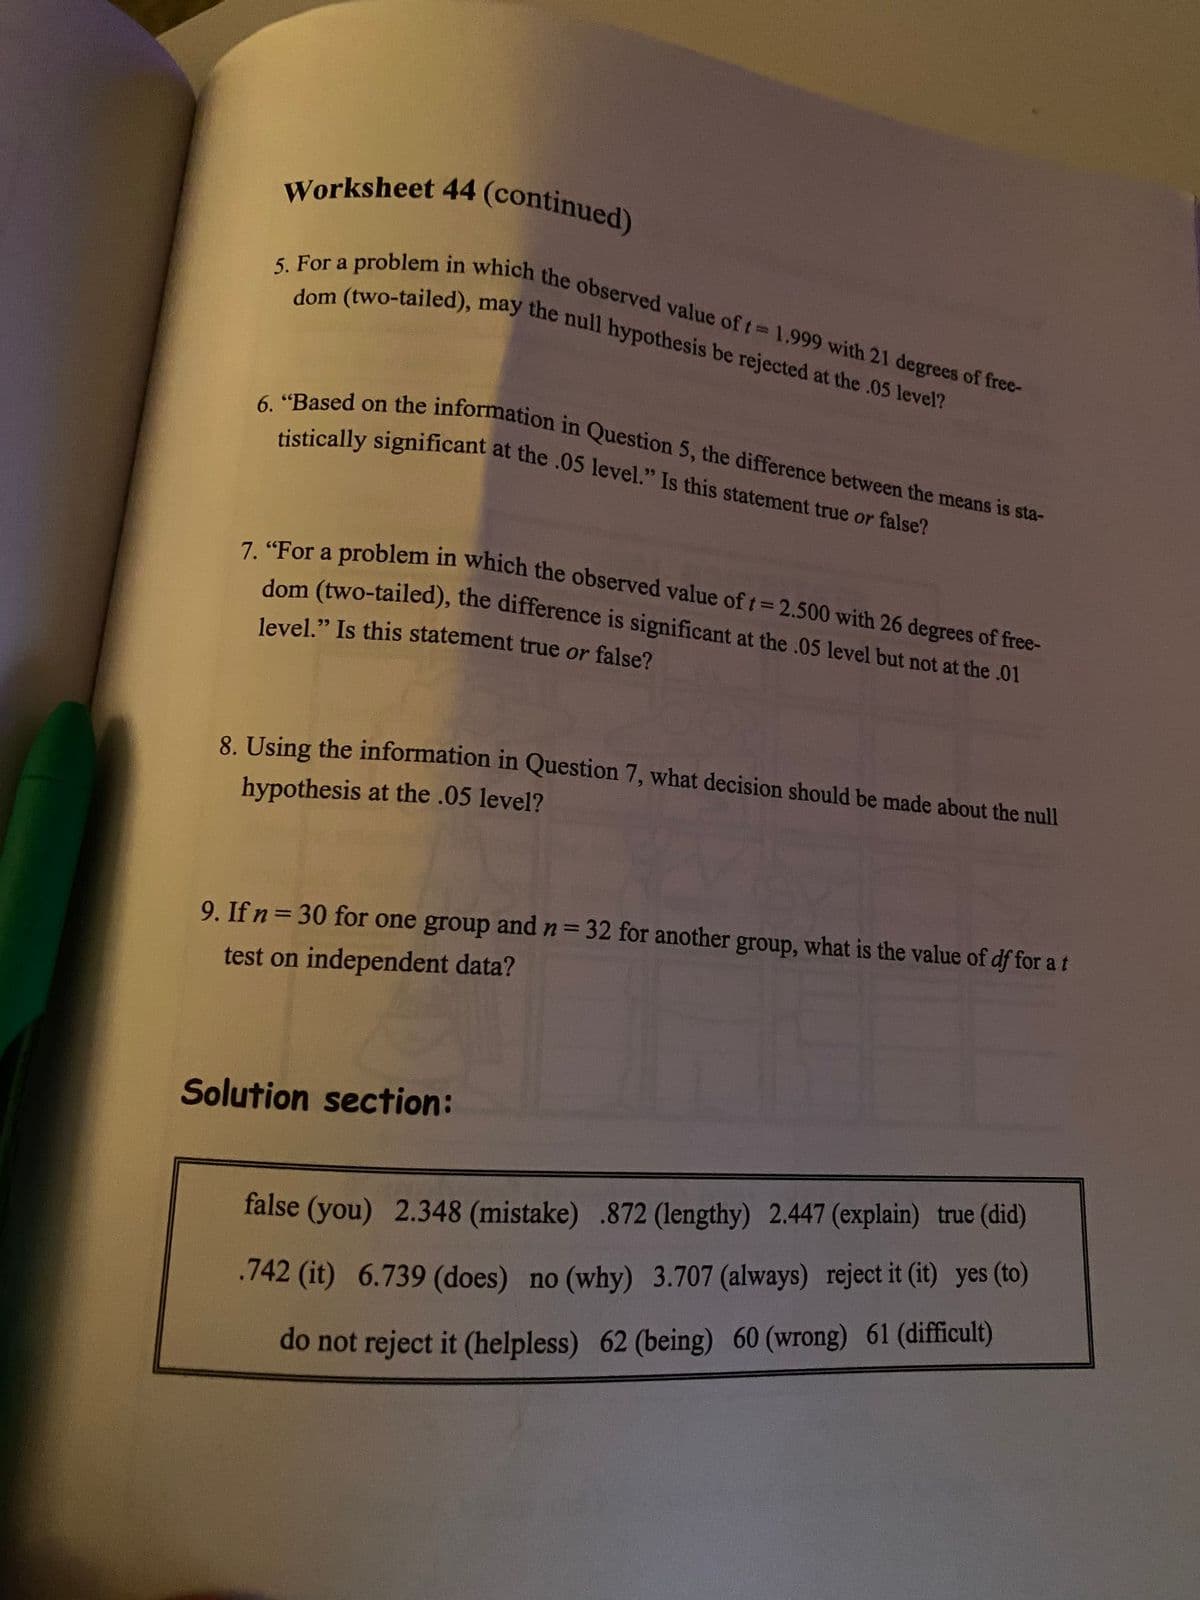
Transcribed Image Text:level." Is this statement true or false?
5. For a problem in which the observed value of t= 1.999 with 21 degrees of free-
7. "For a problem in which the observed value of t 2.500 with 26 degrees of free-
dom (two-tailed), may the null hypothesis be rejected at the .05 level?
Worksheet 44 (continued)
6. "Based on the information in Question 5, the difference between the means is sta-
Worksheet 44 (continued)
a
.ically significant at the .05 level." Is this statement true or false?
dom (two-tailed), the difference is significant at the .05 level but not at the .01
8 Using the information in Question 7, what decision should be made about the null
hypothesis at the .05 level?
9. If n= 30 for one group and n= 32 for another group, what is the value of df for a t
%3D
test on independent data?
Solution section:
false (you) 2.348 (mistake) .872 (lengthy) 2.447 (explain) true (did)
.742 (it) 6.739 (does) no (why) 3.707 (always) reject it (it) yes (to)
do not reject it (helpless) 62 (being) 60 (wrong) 61 (difficult)
Expert Solution
This question has been solved!
Explore an expertly crafted, step-by-step solution for a thorough understanding of key concepts.

This is a popular solution!

Trending now
This is a popular solution!

Step by step
Solved in 2 steps

Knowledge Booster


Learn more about
Need a deep-dive on the concept behind this application? Look no further. Learn more about this topic, statistics and related others by exploring similar questions and additional content below.Recommended textbooks for you
MATLAB: An Introduction with Applications
Statistics
ISBN:
9781119256830
Author:
Amos Gilat
Publisher:
John Wiley & Sons Inc

Probability and Statistics for Engineering and th…
Statistics
ISBN:
9781305251809
Author:
Jay L. Devore
Publisher:
Cengage Learning

Statistics for The Behavioral Sciences (MindTap C…
Statistics
ISBN:
9781305504912
Author:
Frederick J Gravetter, Larry B. Wallnau
Publisher:
Cengage Learning
MATLAB: An Introduction with Applications
Statistics
ISBN:
9781119256830
Author:
Amos Gilat
Publisher:
John Wiley & Sons Inc
Probability and Statistics for Engineering and th…
Statistics
ISBN:
9781305251809
Author:
Jay L. Devore
Publisher:
Cengage Learning
Statistics for The Behavioral Sciences (MindTap C…
Statistics
ISBN:
9781305504912
Author:
Frederick J Gravetter, Larry B. Wallnau
Publisher:
Cengage Learning

Elementary Statistics: Picturing the World (7th E…
Statistics
ISBN:
9780134683416
Author:
Ron Larson, Betsy Farber
Publisher:
PEARSON

The Basic Practice of Statistics
Statistics
ISBN:
9781319042578
Author:
David S. Moore, William I. Notz, Michael A. Fligner
Publisher:
W. H. Freeman

Introduction to the Practice of Statistics
Statistics
ISBN:
9781319013387
Author:
David S. Moore, George P. McCabe, Bruce A. Craig
Publisher:
W. H. Freeman