%3D A company makes solar panels. The company's revenue function, in dollars, is R(n)=10n, where n is the number of panels produced. The cost function is C(n)=100(2)30. R and Care shown on the graph below. y 1000 800 600 400 200 0. 20 40 60 80 100 n Number of Panels a) Estimate from the graph ) the break-even points ii) the number of panels that should be produced for maximum profit b) Write the equation for the profit function P. c) Graph P. d) Use your graph of P to estimate the number of panels that give maximum profit. e) How vould your answers for break-even points and maximum profit change if ) the number of dollars of revenue per panel is increased slightly? ii) the cost function is changed to C(n) = 100(2)35? f) What does the number that was changed in part e) ii) represent? Dollars
%3D A company makes solar panels. The company's revenue function, in dollars, is R(n)=10n, where n is the number of panels produced. The cost function is C(n)=100(2)30. R and Care shown on the graph below. y 1000 800 600 400 200 0. 20 40 60 80 100 n Number of Panels a) Estimate from the graph ) the break-even points ii) the number of panels that should be produced for maximum profit b) Write the equation for the profit function P. c) Graph P. d) Use your graph of P to estimate the number of panels that give maximum profit. e) How vould your answers for break-even points and maximum profit change if ) the number of dollars of revenue per panel is increased slightly? ii) the cost function is changed to C(n) = 100(2)35? f) What does the number that was changed in part e) ii) represent? Dollars

Managerial Economics: Applications, Strategies and Tactics (MindTap Course List)
14th Edition
ISBN:9781305506381
Author:James R. McGuigan, R. Charles Moyer, Frederick H.deB. Harris
Publisher:James R. McGuigan, R. Charles Moyer, Frederick H.deB. Harris
Chapter8: Cost Analysis
Section: Chapter Questions
Problem 9E

Related questions

Question
only d,e,f please
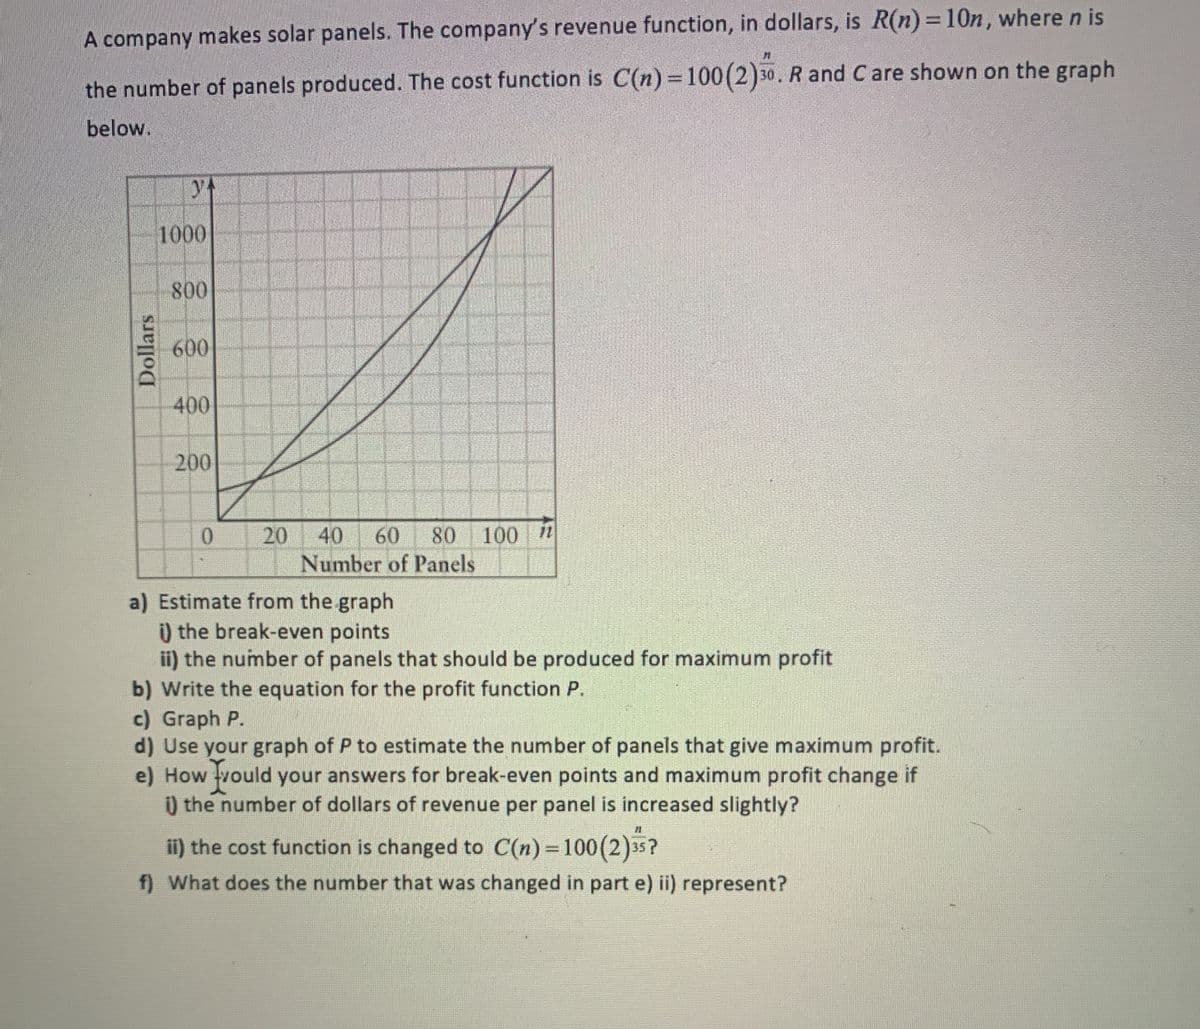
Transcribed Image Text:A company makes solar panels. The company's revenue function, in dollars, is R(n)= 10n, where n is
the number of panels produced. The cost function is C(n) 100(2)30. R and C are shown on the graph
below.
1000
800
600
400
200
20
Number of Panels
0.
40
60
80
100 i
a) Estimate from the graph
0 the break-even points
ii) the number of panels that should be produced for maximum profit
b) Write the equation for the profit function P.
c) Graph P.
d) Use your graph of P to estimate the number of panels that give maximum profit.
e) How vould your answers for break-even points and maximum profit change if
the number of dollars of revenue per panel is increased slightly?
ii) the cost function is changed to C(n)=100(2)35?
f) What does the number that was changed in part e) ii) represent?
Dollars
Expert Solution
This question has been solved!
Explore an expertly crafted, step-by-step solution for a thorough understanding of key concepts.

This is a popular solution!

Trending now
This is a popular solution!

Step by step
Solved in 5 steps with 1 images

Knowledge Booster


Learn more about
Need a deep-dive on the concept behind this application? Look no further. Learn more about this topic, economics and related others by exploring similar questions and additional content below.Recommended textbooks for you
Managerial Economics: Applications, Strategies an…
Economics
ISBN:
9781305506381
Author:
James R. McGuigan, R. Charles Moyer, Frederick H.deB. Harris
Publisher:
Cengage Learning

Managerial Economics: A Problem Solving Approach
Economics
ISBN:
9781337106665
Author:
Luke M. Froeb, Brian T. McCann, Michael R. Ward, Mike Shor
Publisher:
Cengage Learning

Managerial Economics: Applications, Strategies an…
Economics
ISBN:
9781305506381
Author:
James R. McGuigan, R. Charles Moyer, Frederick H.deB. Harris
Publisher:
Cengage Learning
Managerial Economics: A Problem Solving Approach
Economics
ISBN:
9781337106665
Author:
Luke M. Froeb, Brian T. McCann, Michael R. Ward, Mike Shor
Publisher:
Cengage Learning


