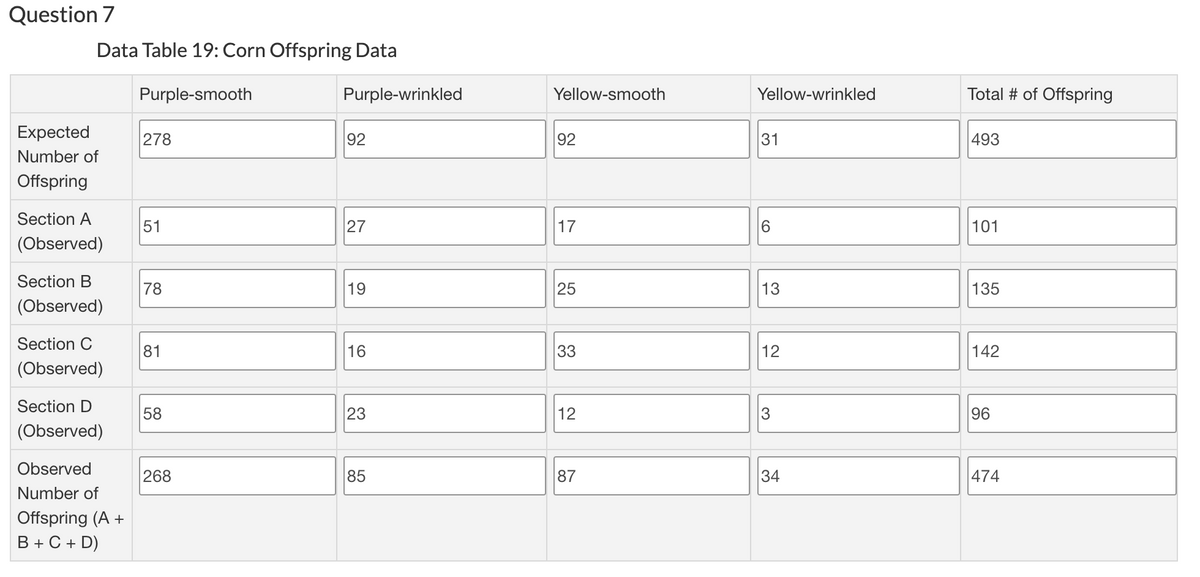
Perform a chi-square analysis using the expected and observed data in Data Table 19. Calculate chi-squared (X2). Show your work in Panel 5.


Q: The income of males in each state of the United States, including the District of Columbia and…
A: Obtain the 90% confidence interval for the difference in incomes between males and females in the…
Q: Use the normal distribution to find a confidence interval for a proportion p given the relevant…
A: From the provided information, Sample size (n) = 110 and p̂ = 0.75 Confidence level = 99%
Q: In a random sample of 678 adult males 20 to 34 years of age, it was determined that 58 of them have…
A:
Q: Find the z-score that has 1.7% of the distribution area to its left.
A: Given z=0.017
Q: Problem 1 (Use R, please show your R codes and output) The dataset prostate (in R package "faraway")…
A: The objective is to fit a model with lpsa as the response variable (y) and lcavol as the predictor…
Q: A company gives an anonymous survey to its employees to see what percent of its employees are happy.…
A: Mean is the average of all the observation in the data set. The sample proportion follows the normal…
Q: A survey was conducted that asked 1007 people how many books they had read in the past year. Results…
A: given data, n=1007df=n-1=1007-1=1006x¯=13.3s=16.6CI=0.99α=1-0.99=0.01we have to find out the…
Q: A simple random sample of size n = 50 is obtained from a population that is skewed left with µ=41…
A: The sample size n is 50.
Q: Consider the following random sample of diameter measurements (in inches) of 9 softballs. 4.87,…
A: Suppose µ is the population mean diameter of a softball.
Q: Exploration 4. Assume that 5 students taking a statistics course having the following ages: 17 33 29…
A: Hi! Thank you for the question, As per the honor code, we are allowed to answer three sub-parts at a…
Q: In an effort to counteract student cheating, the professor of a large class created four versions of…
A: Given Information: Group Sample size Sample mean Standard variance Version A 76 157.1 426.4…
Q: You are given the following data, which you intend to model as a Poisson distribution. Data value 0…
A: The pdf of Poisson distribution is, Px=e-μμxx! The mean is computed as follows:…
Q: Hypothesis test Leila recently switched her primary doctor to one specializing in caring for elderly…
A: Given: μ = 120 n = 15 X = 131 s = 20 α = 0.05 Formula Used: Test-statistic t = X-μsn
Q: Identify the t-statistic and P-value.
A: The sample size n is 23.
Q: A project manager is attempting to estimate the time that will be required to complete an initial…
A: Let X be the time taken to complete the initial assessment phase follows Uniform distribution with…
Q: (a) The moment generating function of X is Mx(t) = A(eBt- ect) D, for some tin the neighbourhood of…
A:
Q: silicon carbide abrasive paper used for grinding cast iron has a mean length of 11 inches and a…
A: given data, the distribution is normal μ=11σ=0.75probability of randomly selecting a silicon…
Q: Pricilla Phranklin opened her clothing store, Pricilla Phashions, in Downtown Dover a little over…
A: Given information: Month Year 1 Demand Year 2 Demand Year 3 Demand January 186 217 212…
Q: ume that a procedure yields a binomial distribution with a trial repeated n times. Use the binomial…
A: given data,binomial distribution,n=4x=3p=0.45q=1-0.45=0.55p(X=x)=nCx *px*qn-x (binomial distribution…
Q: Identify and describe a type of reliability that measures participant reliability. Why is it useful
A: Internal consistency assesses the correlation between multiple items in a test that are intended to…
Q: () The drawer still contains 40 socks - 20 blue, 10 purple and 10 green socks. Let's assume that we…
A: Given; Total number of socks in drawer = 40 socks40 socks = 20 bluem 10 purple and 10 green socks
Q: Telephone Calls A researcher knew that before cell phones, a person made on average 3.1 calls per…
A: Given n=26 Alpha=0.10 Standard deviation=0.6
Q: Course: Statistics - Lineal Regression Property brokers often need to know how appraisal of a…
A: Given: n = 10 α = 0.05 Formula Used: The equation of the regression line is: Y = a + bX b =…
Q: Assume that the probability of a being born with Genetic Condition B is p = 29/30. A study looks at…
A: Given data, p=2930 =0.9667n=174we have to find out the mean and standard deviation for the given…
Q: A simple random sample of size n is drawn. The sample mean, ¿, is found to be 17.7, and the sample…
A: Solution: Given information: x =17.7 Sample mean s= 4.3 Sample standard deviation
Q: 1. Consider Rolling a Fair six sided Dice with sides of 1 through 6. Consider rolling this dice 70…
A: Given that The probability of getting any number in a six sided Dice is 1/6 each.
Q: Two samples are taken with the following sample means, standard deviations, and sample sizes. We…
A: Solution: Given information: x1=30s1=2n1=50x2= 22s2=4n2=73
Q: A study was undertaken to see how accurate food labeling for calories on food that is considered…
A: Given:
Q: Giving a test to a group of students, the grades and gender are summarized below A B C…
A: Given data is A B C Total Male 2 9 13 24 Female 3 7 11 21 Total 5 16 24 45
Q: Suppose 3% of the people contacted by phone are receptive to a certain sales pitch and buy your…
A: given data p = 0.03 n = 2000 P(x>100) = ?
Q: Claim: The mean pulse rate (in beats per minute) of adult males is equal to 69 bpm. For a random…
A: given data claim : μ = 69 n = 151 x¯ = 67.9 s = 11.2 test statistic = ?
Q: . Rini prefers red M&Ms over any other color. The Mars Company, makers of M&Ms, claims that 20% of…
A: Solution: Let X be the number of M&Ms red from the bag. The probability of M&Ms red…
Q: In a clinical trial of a drug intended to help people stop smoking, 128 subjects were treated with…
A: The question is about power of test Given : Power of test = 0.95 Claim : more than 8 % of the drug's…
Q: A company sells 20-ounce bottles of soda. There isn’t exactly 20 ounces in every single bottle,…
A: Given Mean=20, sd=0.143, n=30
Q: b) Fill in the missing values '*', *** ***** ***** and ***:
A: Solution: Given information: r= 3 number of rows c= 5 number of column n= 185 Total observation
Q: The table below shows the amount of time each of the 15 students in an introductory philosophy class…
A: The table below shows the amount of time each of the 15 students in an introductory philosophy class…
Q: Problem 4) If X is a continuous uniform (-5, 5) random variable, find the following: a) What is the…
A: It is given that the continuous Uniform distribution with parameters a = -5 and b = 5 i.e, X ~ U(-5,…
Q: A regression was run to determine if there is a relationship between hours of TV watched per day (x)…
A: Given info: A regression was run to determine if there is a relationship between hours of TV watched…
Q: Suppose a mutual fund qualifies as having moderate risk if the standard deviation of its monthly…
A: The population standard deviation is 4 and sample standard deviation is 3.48. The sample size is 26.
Q: Given are five observations for two variables, x and y. (Round your answers to two decimal places.)…
A:
Q: How can the values in the Difference row of the table be interpreted?
A: the values in the Difference row of the table be interpreted
Q: Every year, Atreyu randomly selects a birthday card from a local greeting card store. The…
A: Given that p = 0.43, and n = 10 By using the a Binomial distribution
Q: pants (a) Find a 95% confidence interval for the mean weight of all bags of potatoes.
A: Given 20.9,21.4,20.6,21.2
Q: According to an expert for the airline industry, 11% of Americans are afraid to fly. Suppose 1200…
A: Given : n=1200 X=149
Q: Refer to the accompanying data display that results from a sample of airport data speeds in Mbps.…
A: given data, (13.046,22.15) x=17.598 Sx=16.01712719 n=50we have to answers the subparts a to d
Q: It is believed that at least 60% of the residents in a certain area favor an annexation suit by a…
A: It is given that Population proportion, p = 60% = 0.60 Sample size, n = 200 Favourable cases, X =…
Q: Find the positive critical value for testing Ho: = 14.22 versus Ha: 14.22 at significance level 0.1…
A: we have to find critical value H0 : μ = 14.22Ha : μ ≠ 14.22α = 0.1n = 26
Q: Question 7 CNNBC recently reported that the mean annual cost of auto insurance is 985 dollars.…
A: According to the given information in this question We need to answer two subparts
Q: A simple random sample of size n is drawn. The sample mean, x, is found to be 18.3, and the sample…
A: given data n = 34x¯ = 18.3s = 4.695% ci for mean(μ) = ?
Q: Test the claim that the mean GPA of night students is larger than 2.7 at the 0.005 significance…
A: The claim is that the mean GPA of night students is larger than 2.7.
- Perform a chi-square analysis using the expected and observed data in Data Table 19.
- Calculate chi-squared (X2). Show your work in Panel 5.
asap please


Trending now
This is a popular solution!

Step by step
Solved in 3 steps

- Olympic Pole Vault The graph in Figure 7 indicates that in recent years the winning Olympic men’s pole vault height has fallen below the value predicted by the regression line in Example 2. This might have occurred because when the pole vault was a new event there was much room for improvement in vaulters’ performances, whereas now even the best training can produce only incremental advances. Let’s see whether concentrating on more recent results gives a better predictor of future records. (a) Use the data in Table 2 (page 176) to complete the table of winning pole vault heights shown in the margin. (Note that we are using x=0 to correspond to the year 1972, where this restricted data set begins.) (b) Find the regression line for the data in part ‚(a). (c) Plot the data and the regression line on the same axes. Does the regression line seem to provide a good model for the data? (d) What does the regression line predict as the winning pole vault height for the 2012 Olympics? Compare this predicted value to the actual 2012 winning height of 5.97 m, as described on page 177. Has this new regression line provided a better prediction than the line in Example 2?Urban Travel Times Population of cities and driving times are related, as shown in the accompanying table, which shows the 1960 population N, in thousands, for several cities, together with the average time T, in minutes, sent by residents driving to work. City Population N Driving time T Los Angeles 6489 16.8 Pittsburgh 1804 12.6 Washington 1808 14.3 Hutchinson 38 6.1 Nashville 347 10.8 Tallahassee 48 7.3 An analysis of these data, along with data from 17 other cities in the United States and Canada, led to a power model of average driving time as a function of population. a Construct a power model of driving time in minutes as a function of population measured in thousands b Is average driving time in Pittsburgh more or less than would be expected from its population? c If you wish to move to a smaller city to reduce your average driving time to work by 25, how much smaller should the city be?Question Two A Deputy Registrar at a certainty university conducted a Chi-Square test of association to establish whether or not employee grade and level of absenteeism were associated. Table 2 below shows part of the results which were obtained. Table 2: Cross tabulation of employee grade and level of absenteeism Contingency Tables Grade LAbsence 1 2 3 Total low Observed 8 1 0 9 Expected 2.90 3.48 2.61 9.00 high Observed 2 11 9 22 Expected 7.10 8.52 6.39 22.00 Total Observed 10 12 9 31 Expected 10.00 12.00 9.00 31.00 2.1 State the appropriate measurement scales for the variables. 2.2 State the null and alternative hypotheses. 2.3 Calculate the expected frequency corresponding to a Grade 3 academic with a high level of absenteeism. 2.4 Find the Chi-Square critical value and test…
- Question #5 A certain statistics instructor participates in triathlons. The accompanying table lists times (in minutes and seconds) he recorded while riding a bicycle for five laps through each mile of a 3-mile loop. Use a 0.05 significance level to test the claim that it takes the same time to ride each of the miles. Does one of the miles appear to have a hill? View the data table of the riding times. Riding times (minutes and seconds) Mile 1 3:14 3:23 3:23 3:22 3:22 Mile 2 3:18 3:23 3:20 3:16 3:18 Mile 3 3:33 3:30 3:28 3:30 3:30 (Note: when pasting the data into your technology, each mile row will have separate columns for each minute and second entry. You will need to convert each minute/second entry into seconds only.) Find the F test statistic. F= ___________ (Round to four decimal places as needed.) Find the P-value…QUESTION 4 (a) The researcher is concerned that older persons may not be knowledgeable of the COFLU-20. As such, he is interested in investigating the association between the age of the respondents and their knowledge level. Table 2 below shows the knowledge level of respondents, by age group. Table 2 Age Group Knowledge Level Total Poor Satisfactory Good 18 - 25 33 16 13 62 26 - 34 30 18 12 60 35 - 44 29 14 12 55 45 - 54 36 16 18 70 55 - 75 17 14 22 53 Total 145 78 77 300 (b) Finally, the researcher is interested in examining the regression model for knowledge, attitude and practices towards the COFLU-20. The following model was developed to forecast individual practices towards COFLU-20 using knowledge and attitude scores. P = α + β K + δ A where P = Practice towards COFLU-20 score K = Knowledge towards COFLU-20 score A = Attitude towards COFLU-20 score The data are processed using…Question 5: A college is interested in if the year of receiving high-level education (college and above) influences students’ salaries when they join the working field. The college randomly selected 4 students who recently received a full- time work offer and collected their year of receiving high-level education and salary per week. The raw data is: Participant Year of high-level education Salary per week Participant 1 4 1150 Participant 2 5 1300 Participant 3 7 1600 Participant 4 2 750 Plot the scatterplot and label the participants. Calculate the correlation coefficient between the year of high-level education and salary per week. Calculate the regression equation using the year of receiving high-level education to predict the salary per week. If a student graduate from college and graduate school in a total of 6 years, what is this student’s predicted salary per week?

