Researchers are interested to determine if there is a relationship between death anxiety and religiosity. 12 people completed death anxiety scale (high score = high anxiety) and completed a checklist designed to measure an individual's degree of religiosity (belief in particular religion, regular attendance at religious service, number of times per week they regularly pray etc.) (High score = greater religiosity) The responses gathered are as follows: Person Death Religiosity a. Show the scatter graph Anxiety 10 11 12 42 29 31 28 15 17 19 11 8 3 14 19 3 11 5 9 6 9 10 15 19 10 14 17 b. Use Correlation Analysis c. Determine the best line fit d. If a person has a death anxiety score of 20, what would be his predicted religiosity? And if the death score is 30?
Q: Question 1 The UWI Open Campus has commissioned a study to determine how student will perform in…
A: Since we only answer up to 3 sub-parts, we'll answer the first 3. Please resubmit the question and…
Q: Assume that a sample is used to estimate a population mean u. Find the 80% confidence interval for a…
A:
Q: Styles A manufacturer knows that their items have a normally distributed lifespan, with a mean of…
A:
Q: A special deck of cards has 5 green cards , and 3 yellow cards. The green cards are numbered 1, 2,…
A: given data A special deck of cards has 5 green cards , and 3 yellow cards. The green cards are…
Q: Explain why the frequency bar graph and the relative frequency bar graph for a data set have a…
A: Solution Given That Explain why the frequency bar graph and the relative frequency bar graph for a…
Q: A particular fruit's weights are normally distributed, with a mean of 689 grams and a standard…
A: The provided information is µ=689 gramsσ=36…
Q: Give two examples ofdata collecting from day -to -day life.
A: There are many example or situations in our life from that we collect the data. Out of this some are…
Q: The accompanying data on x = UV transparency index and y= maximum prevalence of infection was read…
A: Given:Let, x=UV transparency indexy=Maximum prevalence of infection was read from a graph in an…
Q: mying asia was read from a graph. The inceperiook vanissie is 50, depaation rate 13 18 43 114 260…
A: (b) Use EXCEL to determine the regression equation. EXCEL procedure: Go to EXCEL Go to…
Q: Buses depart from a bus stop every 10 minutes from 00:00. One person came to the bus stop without…
A: Solution Given X denotes the time this person has to wait.
Q: Find the minimum sample size n needed to estimate u for the given values of c, o, and E. c = 0.90, o…
A: Given C=0.90 Standard deviations=9.8 Error=1
Q: Data for Simple Linear Regression. xi 55 11 yi 5 25 12 15 20 16 30 10 Calculate y at x = 5.5 9 7 30…
A:
Q: A study was conducted to measure the weights of cabbage produced by a farm in Benguet. The weights…
A: GivenMean(x)=781.6standard deviation(σ)=88.4
Q: The manager of a computer retails store is concerned that his suppliers have been giving him laptop…
A: The answer is attached below,
Q: A letter is known as to have come from either TATANAGAR or CALCUTTA. On the envelope, just two…
A:
Q: A sample survey, connected with the companies monthly advertisement costs was conducted. It involved…
A: Since you have posted a question with multiple sub-parts, we will solve the first three sub-parts…
Q: A stent is a wire mesh tube that is placed in a blood vessel to keep it open. A total of 1120…
A:
Q: The CEO of a large cable company claims that 75 percent of his 1,000,000 customers are satisfied…
A:
Q: John's answering machine receives about 24 telephone calls between 8:00 am and 10:00 am. What is the…
A:
Q: An avid traveler is investigating whether travel websites differ in their pricing. She chooses a…
A: The mean difference is 5.49 and the standard deviation is 18.65.
Q: ducted on 108 individuals to determine if their attraction to a prospective partner is impacted by…
A: Given: The study conducted on Single, dating and married individuals. Individuals were classified…
Q: I needed help with part d. (d) between 160 and 161, inclusive are on time But it was nice to…
A: For the help of part d. (d) between 160 and 161, inclusive are on time.
Q: Noise Levels in Hospitals In a hospital study, it was found that the standard deviation of the sound…
A:
Q: Make a venn Diagram: In our classroom of 39 students, 11 students have a blue pen, 14 students have…
A: Total number of students = 39 No. of Students having only blue pen = 11 No. of Students having only…
Q: 1) Define a martingale sequence. Give the intuition of it and two examples.
A: Comment “Since you have asked multiple questions, we will solve the first question for you. If you…
Q: Twenty sculptors were asked to produce molds of a model using a different medium for each one. The…
A: Given: Twenty sculptors producing moulds of model uses different medium. The options are photograph,…
Q: It is believed that from among senior high school students, 15% would like to pursue engineering…
A:
Q: It is claimed that the average life span of people in rural area is more than 64 years old with a…
A: The following information has been provided. Hypothesized mean μ0=64. Population standard deviation…
Q: QUESTION 12 A country uses labor to produce cars and beer in autarky. When it begins trade with…
A: We know, For free trade, Exported goods price will rise. Imported goods price will be down. In our…
Q: (d) Suppose a poker machine is set so that the amount of play time in minutes between payouts (of…
A:
Q: What is the probability that the value is 0 0.2 A local charity holds a carnival to raise moneyIn…
A:
Q: 3. A medical technologist claims that 25% of the chain-smokers are teenagers. After making a survey…
A: 3)Givensample size(n)=42x=8p^=xn=842≅0.1905Confidence level=95%α=1-0.95=0.05
Q: A stent is a wire mesh tube that is placed in a blood vessel to keep it open. A total of 1120…
A: The following information has been given: Hypothesized proportion p0=0.15. favorable cases: X=134…
Q: Table below shows the weight of 40 female students of a certain nursing school. Weight (pounds) 80 -…
A: Solution Given data is
Q: 1. The following data has been collected to determine if a relationship exists between the amount of…
A: In the given scenario, data was given from the years 1995 to 1999 which shows the snowfall and…
Q: (4) after the year 2000. Round each decimal answer to two decimal places. What was the population of…
A: Given A formula representing US state population from the year 2000.we need t determine population…
Q: Which of the following is NOT a requirement of a binomial random variable? all of these are…
A: The binomial random variable has only two possible outcomes on each trial. Results from counting…
Q: I am not understanding what the (normal dist excel) info is and where these numbers come from? and I…
A: Here, P(Z< z ) =0.99 The aim is to find the Z score value so that 99% of area less than it.
Q: 2. The table gives information about the selling price and the mileages of 8 used cars. Selling…
A: Spearman rank correlation is used to measure the categorical variable. It is used to find the degree…
Q: Suppose you play a game that you can only either win or lose. You win a game with probability 0.40.…
A: Given data: Probability = 0.40 n = 10 Each game is independent
Q: QUESTION 2 A real estate agent believes that most of the home prices are low with few homes have…
A: The objective is to define the nature of the skewness of the distribution of home prices at a…
Q: ) What conditions are necessary for your calculations? (Select all that apply.) O uniform…
A: Given Suppose x has a normal distribution s = 1.7 Xbar=50 n=12
Q: Definition of what probability concept is?
A: We need to define the concept of probability: -
Q: 4. Interpret the given scatterplots (Shape (form), Trend (direction), and Variation (strength) based…
A: Scatter plot is the visual representation of the correlation. It shows the degree of association…
Q: Daily Rainfall 00040 0.80-0.99 1.00-1.19 1.20-1.39 nts the daily rainfall (in inches) for one month.…
A: Given data set represent the daily rainfall in inches 0.42 0 0 0.21 0 0.46 0 0.18 0 0 1.35 0…
Q: A study was conducted to investigate the interactions between California sheephead, macroalgae, and…
A: Solution: The path diagram of a particular study is given.
Q: A ski resort claims that there is a 75% chance of snow on any given day in January and that snowfall…
A:
Q: (c) Find the third quartile of the above data. 87 88.5 057 58.5
A:
Q: An article on estimating 28-day strength of concrete considered regressing y = 28-day standard-cured…
A: In the given scenario, a regression equation was given which showed the relationship between the…
Q: A data set is given below. (a) Draw a scatter diagram. Comment on the type of relation that…
A: Given data: x 1 1 3 5 6 6 y 5.4 6.8 5.8 3.6 2.8 3.1
CAN YOU DO THIS TYPEWRITTEN ONLY? I WILL UPVOTE I PROMISE. THANK YOU SO MUCH FOR YOUR EFFORT. MUCH APPRECIATED
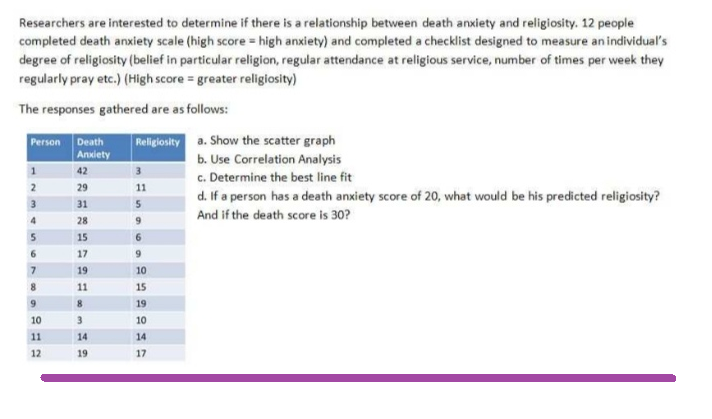
Step by step
Solved in 5 steps with 1 images
- A data set from a study that examined the effect of a specific diet on blood pressure is provided . Participants (n = 72) were randomly assigned either to a group that was put on the diet (Diet = Present) or to a group that was not put on the diet (Diet = Absent), and researchers wanted to know whether the diet had a significant impact on blood pressure. Fully interpret the results in the context of this study (i.e., report the conclusions as related to the research question).A researcher is interested in the relationship between total student debt after graduating college and depression. In order to test the hypothesis that students with more debt are more depressed, the researcher conducts a cross-sectional study that inquires about indebtedness after graduation and asks participants to complete the geriatric depression scale (GDS) test to quantify their depression on a scale of 1-15, 15 being the most depressed. The following table should be considered a SRS of participants’ responses relative to the variables of interest. Indebtedness at Graduation ($) Performance on GDS (1-15) 75,438 8 89,653 9 112,653 11 109,563 10 56,863 6 A) Calculate basic descriptive statistics for your predictor and outcome variables. B) Perform a formal test addressing the correlation between your predictor and outcome variables. (Use alpha = 0.05). C) Interpret your results.People often wait till middle age to worry about having a healthy heart. However, recent studies have shown that earlier monitoring of risk factors such as blood pressure can be very beneficial (The Wall Street Journal, January 10, 2012). Having higher than normal blood pressure, a condition known as hypertension, is a major risk factor for heart disease. Suppose a large sample of individuals of various ages and gender was selected and that each individual’s blood pressure was measured to determine if they have hypertension. For the sample data, the following table shows the percentage of individuals with hypertension. Develop a side-by-side bar chart with age on the horizontal axis, the percentage of individuals with hypertension on the vertical axis, and side-by-side bars based on gender. What does the display you developed in part (a), indicate about hypertension and age? Comment on differences in gender. Age Male Female 20 - 34 11.0% 9.0% 35 – 44…
- The 5-year incidence of cardiovascular disease (CVD) in relation to smoking status was determined in a population sample of 1000 men, 18 years and older. At baseline, 30% of the men were classified as being current smokers and 70% as being non-smokers. At the end of the follow-up, 60 CVD events had occurred among the smokers and 70 events among the non-smokers. Construct a 2 x 2 table based on the data providedA social psychologist wants to know if people judge a person's attractiveness differently if they appear rich or poor. Two pictures were taken with the same model, one in expensive clothes standing next to a new sports car, and the other in old clothes standing next to an old hatchback car. In an online survey, participants were randomly divided so that they saw one of the two pictures and were asked to rate the model's attractiveness on a scale of 1 to 10. Which statistical test would be best to determine if there is a significant difference between groups? one-sample t-test dependent samples t-test independent samples t-test ANOVAThe 5-year incidence of cardiovascular disease (CVD) in relation to smoking status was determined in a population sample of 1000 men, 18 years and older. At baseline, 30% of the men were classified as being current smokers and 70% as being non-smokers. At the end of the follow-up, 60 CVD events had occurred among the smokers and 70 events among the non-smokers. What is the relative risk for CVD for smokers compared non-smokers? Please interpret the result.
- A data set from a study that examined the effect of a specific diet on blood pressure is below. Participants (n = 72) were randomly assigned either to a group that was put on the diet (Diet = Present) or to a group that was not put on the diet (Diet = Absent), and researchers wanted to know whether the diet had a significant impact on blood pressure. Before conducting the test, evaluate the normality assumption for the test and report the results (i.e., is the assumption reasonable for this analysis/data set?). Biofeedback Drug Diet BldPres Present X Absent 170 Present X Absent 175 Present X Absent 165 Present X Absent 180 Present X Absent 160 Present X Absent 158 Present X Present 161 Present X Present 173 Present X Present 157 Present X Present 152 Present X Present 181 Present X Present 190 Present Y Absent 186 Present Y Absent 194 Present Y Absent 201 Present Y Absent 215 Present Y Absent 219 Present Y Absent 209 Present Y Present 164…A study is designed to test whether there is a difference in mean daily calcium intake in adults with normal bone density, adults with osteopenia (a low bone density which may lead to osteoporosis) and adults with osteoporosis. Adults 60 years of age with normal bone density, osteopenia and osteoporosis are selected at random from hospital records and invited to participate in the study. Each participant's daily calcium intake is measured based on reported food intake and supplements. The data are shown below. Is there a statistically significant difference in mean calcium intake in patients with normal bone density as compared to patients with osteopenia and osteoporosis?A research team is interested in investigating the effectiveness of a new medication intended to reduce resting heart rate (beats per minute, BPM) in overweight patients. In order to test the medication, the researcher organizes a clinical trial with participants randomly assigned to receive either the new medication or a placebo. Suppose the following table represents the heart rates for a SRS from both groups. Data for the placebo group are {71, 71, 68, 67, 68, 69, 70, 70, 69, 72, 73} Data for the treatment group are {67, 66, 64, 64, 65, 64, 59, 63, 71, 64} Sample standard deviation for the placebo group is: 1.834 Sample standard deviation for the treatment group is: 3.057 Is there a significant difference between to the two sites? (alpha=0.05) Group of answer choices Yes (Reject the null hypothesis) Yes (Accept the null hypothesis) No (Reject the null hypothesis) No (Accept the null hypothesis)
- A research team is interested in investigating the effectiveness of a new medication intended to reduce resting heart rate (beats per minute, BPM) in overweight patients. In order to test the medication, the researcher organizes a clinical trial with participants randomly assigned to receive either the new medication or a placebo. Suppose the following table represents the heart rates for a SRS from both groups. Data for the placebo group are {71, 71, 68, 67, 68, 69, 70, 70, 69, 72, 73} Data for the treatment group are {67, 66, 64, 64, 65, 64, 59, 63, 71, 64} Sample standard deviation for the placebo group is: 1.834 Sample standard deviation for the treatment group is: 3.057 What is the test statistics (tstat)? (alpha=0.05) Group of answer choices 4.127 2.791 1.674 4.594Studies have suggested that alcohol abuse and disorders are found to be more prevalent during early adulthood than in any other age group, with about 9% of young adults (age 18 to 29 years) meeting the criteria to be labeled as alcoholic. In addition, surveys have shown that college students tend to drink more than their peers who do not attend college. You want to test to see if there are differences in excessive alcohol use in young adults that attend college versus those who do not, so you surveyed 405 young adults, age 19 to 22, about their alcohol use by asking the question, "Have you consumed alcohol to the point of intoxication at least once within the past month?" with the following results. Young Adults Attending College Young Adults Not Attending College n1 = 255 n2 = 150 y1 = 96 said "yes" y2 = 44 said "yes" p̂1 = 96 255 p̂2 = 44 150 (a) Calculate the test statistic. (Round your answer to two decimal places.) (b) If H0:…A researcher is interested in whether a difference can occur between scores on one of the Maryland Addiction Questionnaire (MAQ) subtest, namely the Motivation for Continued Treatment (MOT) among inmates incarcerated for operating a vehicle Under the Influence(OUI). One group of subjects was assigned to a treatment facility for dealing with drug abuse issues, and the other group of 20 subjects continued in the main jail with no treatment being provided. The scores follow: Treatment group 47, 50, 41, 52, 48, 46, 50, 44, 60, 48, 46, 47, 41, 39, 58, 45, 62, 50, 39, 47 Non treated group 41, 45, 40, 40, 33, 41, 42, 43, 37, 33, 53, 40, 38, 43, 55, 31, 37, 53, 38, 40 Test the research hypothesis that there will be a difference between the two sets of scores (find the t score) Calculate a confidence interval at the .95 level for establishing the true population difference between the groups [find the CI(confidence interval)] Indicate the type of research and, if appropriate, the…