person weighed is the first person to be overweight. b. There are 120 overweight Americans c. What is the expected number of overweight Americans? d. What is the standard deviation?
person weighed is the first person to be overweight. b. There are 120 overweight Americans c. What is the expected number of overweight Americans? d. What is the standard deviation?

Glencoe Algebra 1, Student Edition, 9780079039897, 0079039898, 2018
18th Edition
ISBN:9780079039897
Author:Carter
Publisher:Carter
Chapter10: Statistics
Section10.4: Distributions Of Data
Problem 19PFA

Related questions
Question
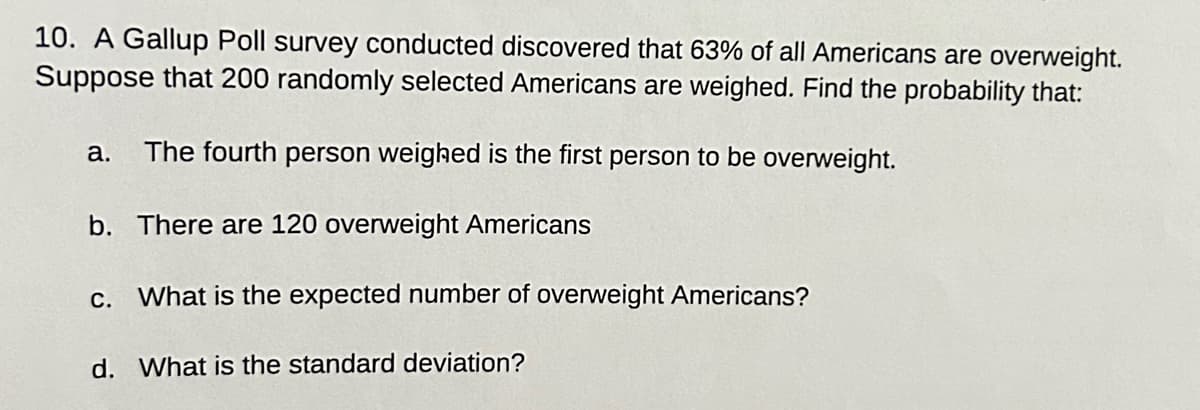
Transcribed Image Text:10. A Gallup Poll survey conducted discovered that 63% of all Americans are overweight.
Suppose that 200 randomly selected Americans are weighed. Find the probability that:
a. The fourth person weighed is the first person to be overweight.
b.
There are 120 overweight Americans
c. What is the expected number of overweight Americans?
d. What is the standard deviation?
Expert Solution
This question has been solved!
Explore an expertly crafted, step-by-step solution for a thorough understanding of key concepts.

Step by step
Solved in 3 steps with 2 images

Recommended textbooks for you
Glencoe Algebra 1, Student Edition, 9780079039897…
Algebra
ISBN:
9780079039897
Author:
Carter
Publisher:
McGraw Hill
Glencoe Algebra 1, Student Edition, 9780079039897…
Algebra
ISBN:
9780079039897
Author:
Carter
Publisher:
McGraw Hill