Pie charts and bar charts are used to display frequency data from A. Qualitative variables B. Quantitative variables D. None C. Categorical variables 2. Histograms are appropriate for displaying the frequency data of A. Qualitative variables B. Quantitative variables D. None C. Categorical variables 3. A data set can have A. One mode C. More than one mode 4. The 75th percentiles of a set of n measurements arranged in order of magnitude, often called B. 0 modes D. None A. Quantile B. Median C. The lower quartile D. The upper quartile 5. The R function for a Poisson distribution i.e., P(y = k) = A. pbinorm(k, µ) C. qnorm(k, u) B. dbinom(k, u) D. dpois (k, p) === is
Pie charts and bar charts are used to display frequency data from A. Qualitative variables B. Quantitative variables D. None C. Categorical variables 2. Histograms are appropriate for displaying the frequency data of A. Qualitative variables B. Quantitative variables D. None C. Categorical variables 3. A data set can have A. One mode C. More than one mode 4. The 75th percentiles of a set of n measurements arranged in order of magnitude, often called B. 0 modes D. None A. Quantile B. Median C. The lower quartile D. The upper quartile 5. The R function for a Poisson distribution i.e., P(y = k) = A. pbinorm(k, µ) C. qnorm(k, u) B. dbinom(k, u) D. dpois (k, p) === is

Glencoe Algebra 1, Student Edition, 9780079039897, 0079039898, 2018
18th Edition
ISBN:9780079039897
Author:Carter
Publisher:Carter
Chapter10: Statistics
Section10.6: Summarizing Categorical Data
Problem 42PFA

Related questions
Question
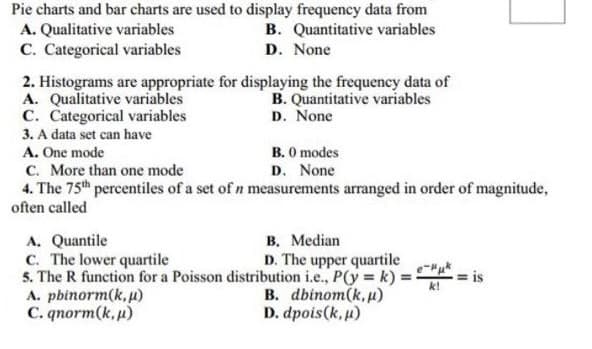
Transcribed Image Text:Pie charts and bar charts are used to display frequency data from
A. Qualitative variables
B. Quantitative variables
D. None
C. Categorical variables
2. Histograms are appropriate for displaying the frequency data of
A. Qualitative variables
B. Quantitative variables
D. None
C. Categorical variables
3. A data set can have
A. One mode
C. More than one mode
4. The 75th percentiles of a set of n measurements arranged in order of magnitude,
often called
B. 0 modes
D. None
A. Quantile
B. Median
C. The lower quartile
D. The upper quartile
5. The R function for a Poisson distribution i.e., P(y = k) = 3 = is
e-μμk
k!
A. pbinorm(k, µ)
C. qnorm(k,u)
B. dbinom(k, u)
D. dpois (k, μ)
Expert Solution
This question has been solved!
Explore an expertly crafted, step-by-step solution for a thorough understanding of key concepts.
Step 1
VIEWPie charts and bar charts are used to display frequency data from
VIEW2 Histograms are appropriate for displaying the frequency data of
VIEWA data set can have
VIEW4 The 75th percentiles of a set of n measurements arranged in order of magnitude, often called
VIEW5. The R function for a Poisson distribution
VIEW
Step by step
Solved in 6 steps

Recommended textbooks for you
Glencoe Algebra 1, Student Edition, 9780079039897…
Algebra
ISBN:
9780079039897
Author:
Carter
Publisher:
McGraw Hill

Holt Mcdougal Larson Pre-algebra: Student Edition…
Algebra
ISBN:
9780547587776
Author:
HOLT MCDOUGAL
Publisher:
HOLT MCDOUGAL
Glencoe Algebra 1, Student Edition, 9780079039897…
Algebra
ISBN:
9780079039897
Author:
Carter
Publisher:
McGraw Hill
Holt Mcdougal Larson Pre-algebra: Student Edition…
Algebra
ISBN:
9780547587776
Author:
HOLT MCDOUGAL
Publisher:
HOLT MCDOUGAL