Use the bar chart below to summarize the data in the form of frequency and relative frequency. Assume that the data was collected from a survey of 2500 people. Hint: You can calculate the frequency by multiplying the total number of people in the study by the relative frequency (in decimal form). All answers in the table are in whole numbers. Type of Pie Apple Strawberry Pumpkin Cherry Blueberry Percentage of Americans Pecan Lemon Meringue Chocolate Chess 20% Pie Flavor Preferences of Americans Percentage of Americans 19% 16% 13% Apple Strawberry Pumpkin Cherry Blueberry Frequency Pie Flavor 8% 8% 5% 296 Pecan Lemon Chocolate Chess Meringue Relative Frequency % % % % % % %
Use the bar chart below to summarize the data in the form of frequency and relative frequency. Assume that the data was collected from a survey of 2500 people. Hint: You can calculate the frequency by multiplying the total number of people in the study by the relative frequency (in decimal form). All answers in the table are in whole numbers. Type of Pie Apple Strawberry Pumpkin Cherry Blueberry Percentage of Americans Pecan Lemon Meringue Chocolate Chess 20% Pie Flavor Preferences of Americans Percentage of Americans 19% 16% 13% Apple Strawberry Pumpkin Cherry Blueberry Frequency Pie Flavor 8% 8% 5% 296 Pecan Lemon Chocolate Chess Meringue Relative Frequency % % % % % % %

Glencoe Algebra 1, Student Edition, 9780079039897, 0079039898, 2018
18th Edition
ISBN:9780079039897
Author:Carter
Publisher:Carter
Chapter10: Statistics
Section10.6: Summarizing Categorical Data
Problem 15PPS

Related questions
Question
Use the bar chart below to summarize the data in the form of frequency and relative frequency. Assume that the data was collected from a survey of 2500 people. Hint: You can calculate the frequency by multiplying the total number of people in the study by the relative frequency (in decimal form). All answers in the table are in whole numbers.
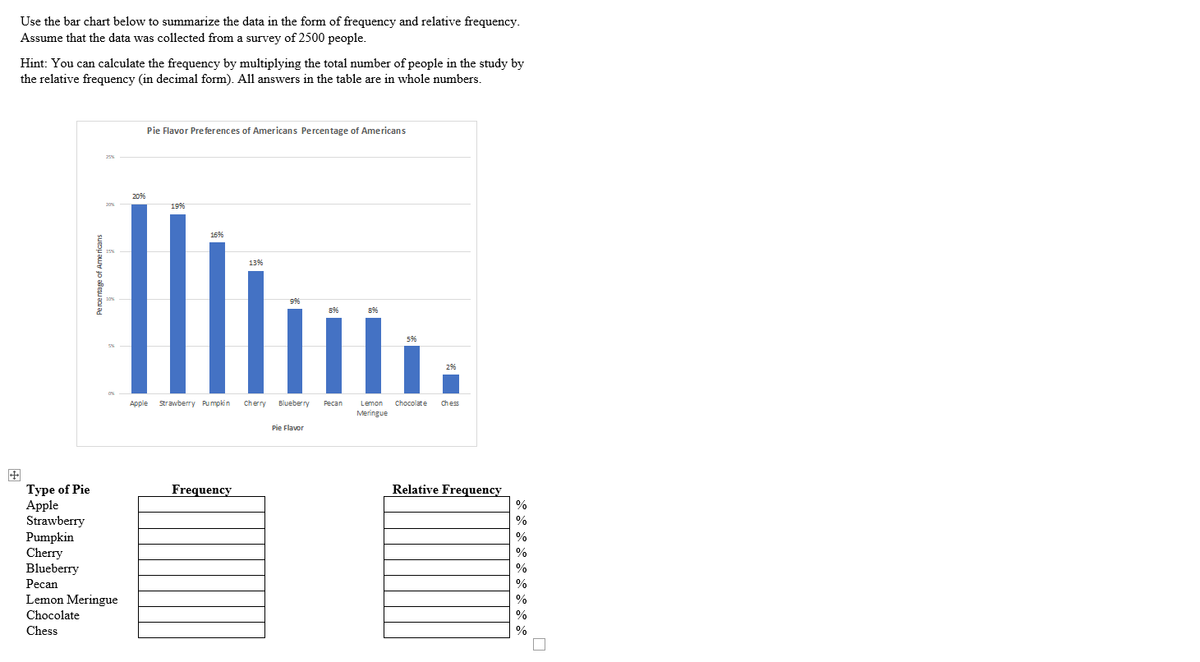
Transcribed Image Text:Use the bar chart below to summarize the data in the form of frequency and relative frequency.
Assume that the data was collected from a survey of 2500 people.
Hint: You can calculate the frequency by multiplying the total number of people in the study by
the relative frequency (in decimal form). All answers in the table are in whole numbers.
Type of Pie
Apple
Strawberry
Pumpkin
Cherry
Blueberry
0%
Pecan
Lemon Meringue
Chocolate
Chess
20%
Pie Flavor Preferences of Americans Percentage of Americans
19%
16%
13%
Apple Strawberry Pumpkin Cherry
Frequency
996
8%
Blueberry Pecan
Pie Flavor
8%
5%
296
Lemon Chocolate Chess
Meringue
Relative Frequency
%
%
%
%
%
%
%
%
%
Expert Solution
This question has been solved!
Explore an expertly crafted, step-by-step solution for a thorough understanding of key concepts.

This is a popular solution!

Trending now
This is a popular solution!

Step by step
Solved in 3 steps with 1 images

Recommended textbooks for you
Glencoe Algebra 1, Student Edition, 9780079039897…
Algebra
ISBN:
9780079039897
Author:
Carter
Publisher:
McGraw Hill

Holt Mcdougal Larson Pre-algebra: Student Edition…
Algebra
ISBN:
9780547587776
Author:
HOLT MCDOUGAL
Publisher:
HOLT MCDOUGAL

Algebra: Structure And Method, Book 1
Algebra
ISBN:
9780395977224
Author:
Richard G. Brown, Mary P. Dolciani, Robert H. Sorgenfrey, William L. Cole
Publisher:
McDougal Littell
Glencoe Algebra 1, Student Edition, 9780079039897…
Algebra
ISBN:
9780079039897
Author:
Carter
Publisher:
McGraw Hill
Holt Mcdougal Larson Pre-algebra: Student Edition…
Algebra
ISBN:
9780547587776
Author:
HOLT MCDOUGAL
Publisher:
HOLT MCDOUGAL
Algebra: Structure And Method, Book 1
Algebra
ISBN:
9780395977224
Author:
Richard G. Brown, Mary P. Dolciani, Robert H. Sorgenfrey, William L. Cole
Publisher:
McDougal Littell