Please answer the following questions using the decision tree: posting again because the last answer was wrong. • A new patient has RealPartMax=-450, ImaginaryPartMax= -315, ImaginaryPartMin = -321. Which diagnosis will they receive? • What is the probability that this new patient has Asthma? • How many patients from the training data will be classified in the bottom left node
Q: How to do an ancova test using r codes to find relationship between two factors for example sun…
A: The aim of this analysis is to investigate the relationship between two factors, sun exposure and…
Q: For most healthy adult women and men, resting heart rates range from 60 to 100 beats per minute. The…
A: The size of each class interval in a frequency distribution is termed 'class width'. It depicts the…
Q: A password for a website must have 4 different digits. How many unique passwords are possible if…
A: The no. of available digits to form passwords are 0,1, 2, 3, 4, 5, 6, 7, 8, and 9.The no. of digits…
Q: Find the standard deviation for the number of people with the genetic mutation in such groups of…
A: Let p be the proportion of the people with the genetic mutation. Given that p = 2% = 0.02Let X…
Q: In a study, the sample is chosen by writing everyone's name on a playing card, shuffling the deck,…
A: The sample is the subset of the population using equal proportions. Here, the sample has been taken…
Q: Suppose that you would like to decrease the probability that you win the game where you propose the…
A: In this question, we are presented with a game where we need to propose a specific number of red and…
Q: How to get points in the parameter from,p(-1.00<z<2.00)
A: Find the probabilityP(-1<Z<2)=?
Q: Each of 7 students reported the num 9,12,7,16,11,17,20 Send data to calculator Find the mean number…
A: The number of observations is 7.
Q: Use the data and story to answer the following questions Linear Regression Application,…
A: The question is about regressionGiven :To find : Reg. eq.A ) How many murders exp. with 4 thousand…
Q: Suppose that you randomly selected 26 adults. Assume 17% of the population smoke. Round all answers…
A: sample size(n)=26p=0.17x~Binomial(n=26,p=0.17)P(X=x)=
Q: Your regression of 45 observations and 4 regressors shows a R = 0.29. What is the value of R²? Enter…
A: The question is about regressionGiven :No. of obs. ( n ) = 45No. of regressors ( k ) = 4 = 0.29To…
Q: 4- Each day, I may go to work by cycling, driving or by bus. The time it takes depends on the mode…
A: Provided data:lightmoderatecongestedBicycle161718Bus101520Car51025
Q: Please do not give solution in image format thanku The maximum wind speed in November can be…
A: In the given scenario, we are dealing with the classification of maximum wind speeds in November on…
Q: a. Explain pearson's correlation coefficient based image. b. Explain each table based image. c.…
A: Given the correlation and regression output of the data.
Q: 68 randomly selected car salespersons were asked the number of cars they generally sell in one week.…
A: No. of people answered that they generally sell 3 cars = 11No. of people answered that they…
Q: Suppose that (X, Y) have a standard Gaussian distribution on R2. Find the expected value E [max(2.1X…
A: has a standard Gaussian distribution on .
Q: Consider the following two statements about adding independent variables into a regression model: 1.…
A: Bias is not always reduced by increasing the number of independent variables in the model: When we…
Q: 6. A school desires to estimate the average score that would be obtained on a reading comprehension…
A: “Since you have posted multiple questions, we will provide the solution only to the first question…
Q: Assume that adults were randomly selected for a poll. They were asked if they "favor or oppose using…
A:
Q: Suppose you want to estimate the effect of access to public transportation on house prices. You…
A: The data is defined below as follows:From the information, given the data is,Where,Price denotes the…
Q: What is the forecast for February, using the Exponential Smoothing method, with alpha= 0.9? (Round…
A: The provided time series data is:MonthRed pens…
Q: a) b) Durbin-Watson test is a procedure which is utilised to check whether the errors ('s) on a time…
A: We have given, (a) Durbin-Watson test is a procedure which is utilized to check whether the errors…
Q: Use the frequency histogram to complete the following parts. (a) Determine the number of classes.…
A: Note: As per our guidelines we are supposed to answer only 3 subparts of any questions so i am…
Q: A data set lists earthquake depths. The summary statistics are n = 500, x= 5.39 km, s=4.27 km. Use a…
A: The earthquakes are from a population with a mean equal to 5.00.
Q: Out of 500 people sampled, 150 had kids. Based on this, construct a 99% confidence interval for the…
A: To construct a 99% confidence interval for the true population proportion of people with kids, we…
Q: Sample median is an unbiased estimator. False O True
A: One of the measures of central tendency is the median.
Q: The graph below shows the number of students at Collins Middle School enrolled in Spanish classes…
A: The objective is to identify the correct statement based on the bar graph. The height of each bar…
Q: Consider a sample of 48 football games, where 33 of them were won by the home team. Use a 0.10…
A: n=48X=33Claim : The probability that the home team wins is greater than one- half and =0.10
Q: Use the table below to answer the question: Activity U W X Y Z Immediate Optimistic Predecessor…
A:
Q: A random sample of 100 observations from a population with standard deviation 71 yielded a sample…
A: The question is about hypo. testingGiven :Randomly selected no. of obs. ( n ) = 100Popl. std.…
Q: Determine if the outcome is unusual. Consider as unusual any result that differs from the mean by…
A: Sample size 80% of them drank coffee every day.Number of coffee drinkers out of 1253 subjects is…
Q: The mean value of land and buildings per acre from a sample of farms is $1800, with a standard…
A: The question is about empirical rule :Given :Sample mean value of land and building per acre ( ) =…
Q: Assume that the probability of a being born with Genetic Condition B is �=1/6. A study looks at a…
A: From the provided information,Probability of a being born with Genetic Condition B is p =1/6Sample…
Q: We want to test whether the population variance of machine component mass meets the requirement of…
A: Claim: The population variance of machine component mass meets the requirement of 4 kg2.
Q: Use the given degree of confidence and sample data to construct a confidence interval for the…
A:
Q: Assume that the probability of a being born with Genetic Condition B is �=1/6. A study looks at a…
A: the probability of a being born with Genetic Condition B is (p)=1/6sample size(n)=532
Q: 64% of all students at a college still need to take another math class. If 4 students are randomly…
A: Probability of students at a college still need to take another math class(p)=0.64…
Q: We are analyzing the effects of regime type on corruption with the following model: Corruption 10…
A: We have given the following model
Q: X, Y, Z ~ beta (alpha=1, beta=2) => p(X < sqrt(YZ)) = ?
A: In this problem, we are given three random variables X, Y, and Z, which are independently…
Q: The following data are the scores of 19 students on an algebra test. 62 , 84 , 87 , 92 , 55 ,…
A: 62,84,87,92,55,75,85,63,58,70,60,86,95,61,92,65,84,75,64sample size(n)=19Arrange the data in…
Q: The following table shows the number of hours some middle school students in two cities spend…
A: The two datasets are given as-City ACity B9627201726241521231225251425141811
Q: Consider two data sets A and B. The sets are identical except the high value of data set B is three…
A: It is given that-We have two datasets A and B which are identical except the maximum value of B is…
Q: Your -2 regression of 46 observations and 5 regressors shows a R = 0.29. What is the value of R²?…
A: The total number of observations is n = 46 and the number of regressors is k = 5.
Q: The calculations for a factorial experiment involving four levels of factor A, three levels of…
A: Two way ANOVA:ANOVA (Analysis of Variance) is a statistical test used to analyze the difference…
Q: The table shows data for bus arrivalsat one stop. By how much time can you expect a bus to be late?…
A: Consider the following table:Minutes Late (x)Number of days (f)xf0801772363412428515Total2538
Q: Solve the following problem using MATLAB. Write the syntax and the MATLAB out put on the space…
A: In this problem, we are given the grades of three students in different components: tests, projects,…
Q: for part d would I just add up all the ones past the 0.5? when I open the table it only goes to 0.5…
A: The information provided in the question are as follows :-Probability of success on a single trial…
Q: why did you add .032 when you did not list it p(x=6)?
A: The probability distribution table of X provided in the question is as follows…
Q: Question 24 For the above question where you calculated reliability of the 24-item test, what test…
A: The reliability of the 24-item test has been computed and the assumption that was needed needs to be…
Q: A local college wants to see if the students in the Psychology department have Ipads at home.…
A: Suppose p is the true population proportion of Psychology students who have Ipads at home.
Please answer the following questions using the decision tree:
posting again because the last answer was wrong.
• A new patient has RealPartMax=-450, ImaginaryPartMax= -315, ImaginaryPartMin = -321. Which diagnosis will they receive?
• What is the probability that this new patient has Asthma?
• How many patients from the training data will be classified in the bottom left node?
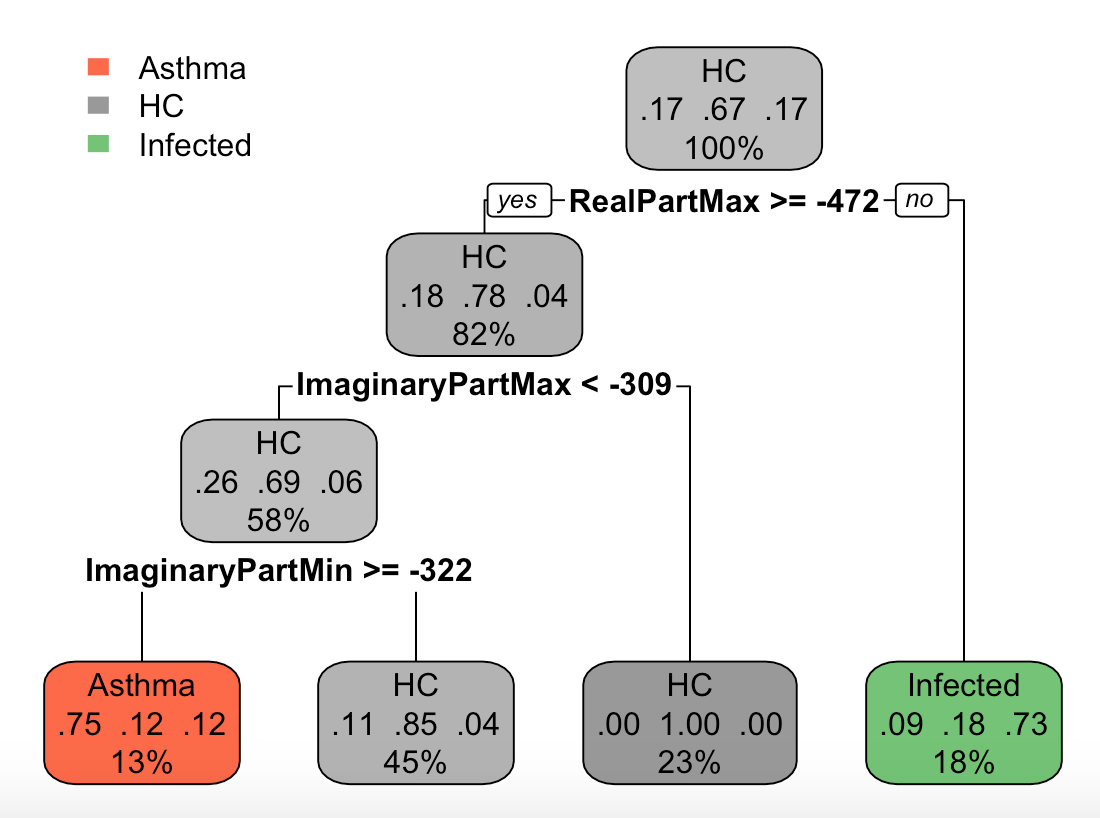
Step by step
Solved in 3 steps
- The permanent residence of adults aged 18-25 in the U.S. was examined in a survey from the year 2000. The survey revealed that 27% of these adults lived alone, 32% lived with a roommate(s), and 41% lived with their parents/guardians. In 2008, during an economic recession in the country, another such survey of 1600 people revealed that 398 lived alone, 488 lived with a roommate(s), and 714 lived with their parents. Is there a significant difference in where young adults lived in 2000 versus 2008 and state the p-value? Test with a Goodness of Fit test at α=0.05. Alone Roommates Parents/Guardians Observed Counts 398 488 714 Expected Counts 432 512 656Suppose that in the previous semester, the percentages of students in the five sections of ECO 204 were 20%, 21%, 19%, 15% and 25%. However, in the current semester, among a sample of 200 students, the student distribution among five sections is 51, 49, 30, 20 and 50. Can we conclude that there has been a statistically significant change in the student proportions?Globally, 35% of all ridged brittleshell tortoises have spots on their shells. A herpetologist in Citition collects a sample of 38 ridged brittlesell tortoises and finds that 16 of them have spots on their shells. The herpetologist would like to test the claim that the proportion of ridged brittleshell tortoises in Cititon with spots on their shells is greater than 35%. The herpetologist ends up rejecting the null hypothesis. If the actual proportion of ridged brittleshell tortoises in Cititon with spots on their shells is 41%, then what type of error, if any, has occurred? In the problem above, what is the test statistic?
- A researcher wants to know why individuals in Community A have a higher rate of a rare form of cancer when compared to those living in Community B. To find out the reasons for the differences in cancer rates in these two communities, the investigator surveyed residents about their lifestyle, noted the types of businesses that were present in the community and searched medical records. The researcher found that the headquarters for the Toxico Chemical Plant is located in Community A, there is a higher rate of cigarette smoking in this community and residents tended to delay or skip going to the doctor for an annual checkup. In Community B, the largest employer was a department store and on average, residents did not smoke as much as residents from Community A. However, like individuals from Community A, Community B residents tended to delay or skip their annual checkup with their doctor. 1. What makes this a descriptive study?The television show Lett3rs has been successful for many years. That show recently had a share of 19, which means, that among the TV sets in use, 19% were tuned to Lett3rs. An advertiser wants to verify that 19% share value by conducting its own survey, and a pilot survey begins with 10 households have TV sets in use at the time of a Lett3rs broadcast. If at most one household is tuned to Lett3rs, does it appear that the 19% share value is wrong? (Hint: Is the occurrence of at most one household tuned to Lett3rs unusual?) A. no, it is not wrongB. yes, it is wrongA big private oil company must decide whether to drill in the Gulf of Mexico. It costs $1 million (i.e., 1M) to drill, and if oil is found its value is estimated at $6 million. At present, the oil company believes that there is 45% chance that oil is present. Before drilling begins, the big private oil company can hire a geologist for $100,000 to obtain samples and test for oil. There is only about a 60% chance that the geologist will issue a favorable report. Given that the geologist does issue a favorable report, there is an 85% chance that there is oil. Given an unfavorable report, there is a 22% chance that there is oil. The following decision tree determine what the big private oil company should do. All the numbers are represented in a million unit.
- A nutritionist believes that obesity is more prevalent among American adults than it was in the past. He discovers that in a study conducted in the year 1994, 380 of the 1630 randomly chosen adults were classified as obese. However, in a more recent study, he finds 726 out of 2350 randomly chosen adults were classified as obese. At α = 0.05, do these studies provide evidence to support the nutritionist's claim that the proportion of obese adults has significantly increased since 1994?A certain financial services company uses surveys of adults age 18 and older to determine if personal financial fitness is changing over time. A recent sample of 1,000 adults showed 410 indicating that their financial security was more than fair. Suppose that just a year before, a sample of 700 adults showed 245 indicating that their financial security was more than fair. (a) State the hypotheses that can be used to test for a significant difference between the population proportions for the two years. (Let p1 = population proportion most recently saying financial security more than fair and p2 = population proportion from the year before saying financial security more than fair. Enter != for ≠ as needed.) H0: Ha: (b) Conduct the hypothesis test and compute the p-value. At a 0.05 level of significance, what is your conclusion? Find the value of the test statistic. (Use p1 − p2. Round your answer to two decimal places.) Find the p-value. (Round your answer to…A certain financial services company uses surveys of adults age 18 and older to determine if personal financial fitness is changing over time. A recent sample of 1,000 adults showed 410 indicating that their financial security was more than fair. Suppose that just a year before, a sample of 1,200 adults showed 420 indicating that their financial security was more than fair. (a) State the hypotheses that can be used to test for a significant difference between the population proportions for the two years. (Let p1 = population proportion most recently saying financial security more than fair and p2 = population proportion from the year before saying financial security more than fair. Enter != for ≠ as needed.) H0: p1−p2=0 Ha: p1−p2!=0 (b) Conduct the hypothesis test and compute the p-value. At a 0.05 level of significance, what is your conclusion? Find the value of the test statistic. (Use p1 − p2. Round your answer to two decimal places.) Find the p-value.…
- A certain financial services company uses surveys of adults age 18 and older to determine if personal financial fitness is changing over time. A recent sample of 1,000 adults showed 410 indicating that their financial security was more than fair. Suppose that just a year before, a sample of 1,200 adults showed 420 indicating that their financial security was more than fair. (a)State the hypotheses that can be used to test for a significant difference between the population proportions for the two years. (Let p1 = population proportion most recently saying financial security more than fair and p2 = population proportion from the year before saying financial security more than fair. Enter != for ≠ as needed.) H0: Ha: (b) Conduct the hypothesis test and compute the p-value. At a 0.05 level of significance, what is your conclusion? Find the value of the test statistic. (Use p1 − p2. Round your answer to two decimal places.) = Find the p-value. (Round your answer to…A student wondered what proportion of a large jar of thousands of marbles were red and speculated that it was 0.30. She took a random sample of 50 marbles and got 18 red marbles, for a sample proportion of 0.36. Below is a dotplot of 100 simulated samples of drawing 50 marbles from a population that is set up to have the proportion of "red marbles" to be 0.30. Based on this dotplot, would getting a sample of 50 marbles to have a 0.36 proportion of red marbles be significant evidence that the true proportion of red marbles in the whole jar is greater than 0.30?2. A leading researcher in the study of interstate highway accidents proposes that a major cause of many collisions on the interstates is not the speed of the vehicles but rather the difference in speeds of the vehicles. When some vehicles are traveling slowly while other vehicles are traveling at speeds greatly in excess of the speed limit, the faster-moving vehicles may have to change lanes quickly, which can increase the chance of an accident. Thus, when there is a large variation in the speeds of the vehicles in a given location on the interstate, there may be a larger number of accidents than when the traffic is moving at a more uniform speed. The researcher believes that when the standard deviation in speed of vehicles exceeds 10 mph, the rate of accidents is greatly increased. During a 1-hour period of time, a random sample of 50 vehicles is selected from a section of an interstate known to have a high rate of accidents, and their speeds are recorded using a radar gun. The data…