I want to explain these tables and output

MATLAB: An Introduction with Applications
6th Edition
ISBN:9781119256830
Author:Amos Gilat
Publisher:Amos Gilat
Chapter1: Starting With Matlab
Section: Chapter Questions
Problem 1P

Related questions
Question
I want to explain these tables and output ?
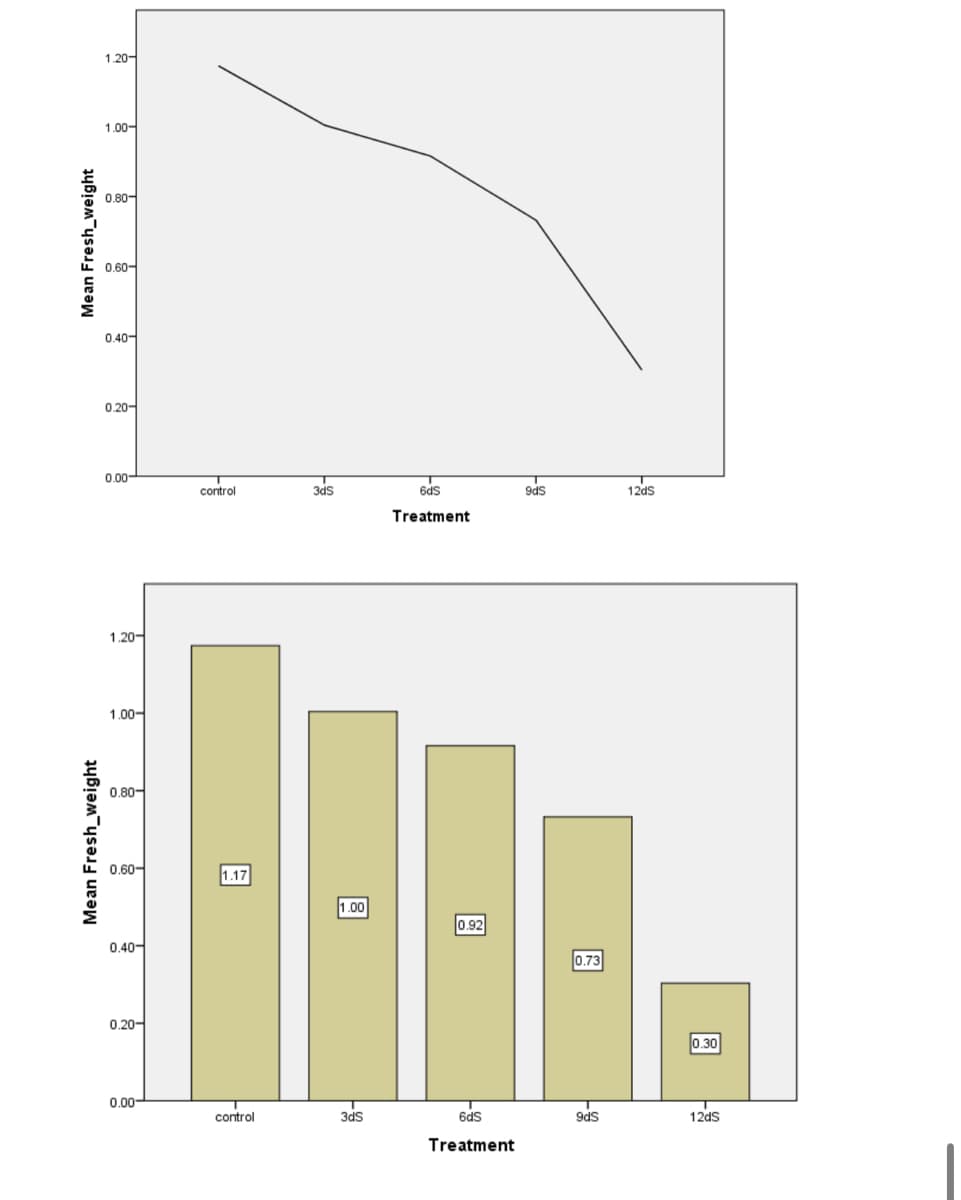
Transcribed Image Text:Mean Fresh_weight
Mean Fresh_weight
1.20
1.00-
0.80-
0.60-
0.40-
0.20-
0.00-
1.20-
1.00-
0.80-
0.60-
0.40-
0.20-
0.00-
control
1.17
control
3ds
1.00
3dS
6dS
Treatment
0.92
6dS
Treatment
9dS
0.73
9dS
12dS
0.30
12dS
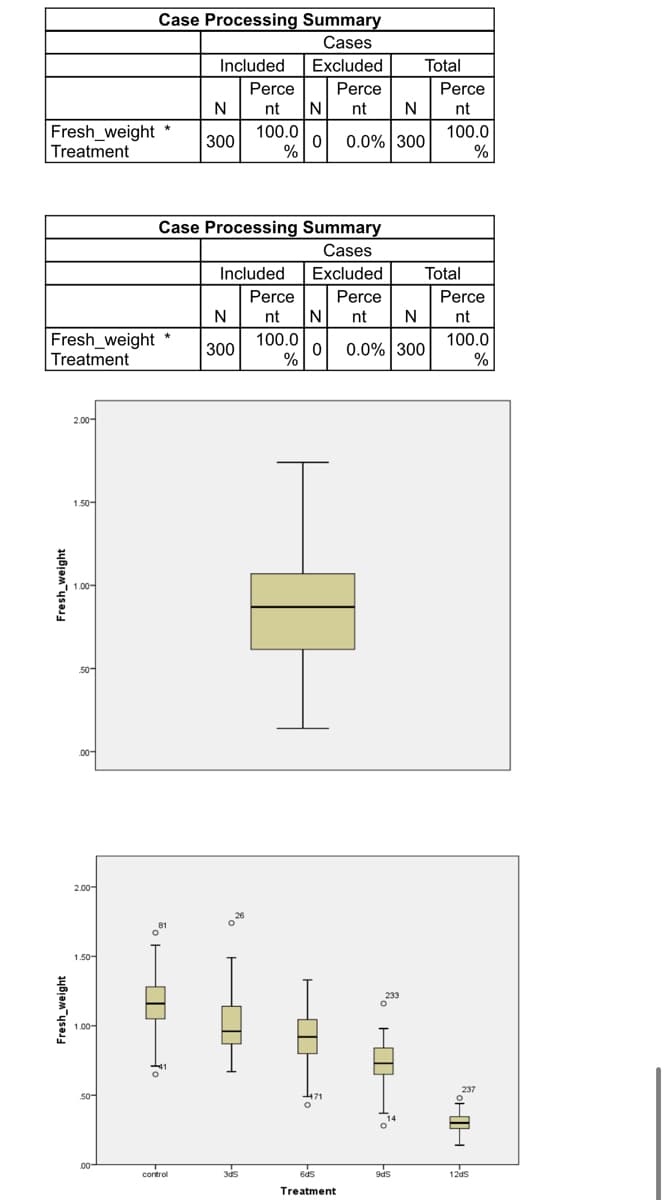
Transcribed Image Text:Fresh_weight
Treatment
Fresh_weight
Treatment
2.00-
1.50-
Fresh_weight
Fresh_weight
1.00-
50-
.00-
2.00-
1.50-
1.00-
50-
.00-
Case Processing Summary
Cases
Included
Excluded
Perce
*
18°
41
N
100.0
300
%
Case Processing Summary
Cases
Included
Excluded
Perce
N
nt N
*
0 0.0% 300
O
control
N
300
26
Perce
3ds
nt N
Perce
nt
100.0
%
nt N
0 0.0% 300
O
1471
0
6ds
Treatment
Total
233
9dS
Perce
nt
100.0
%
Total
Perce
nt
100.0
%
H
HHO
12dS
Expert Solution
This question has been solved!
Explore an expertly crafted, step-by-step solution for a thorough understanding of key concepts.

Step by step
Solved in 3 steps

Recommended textbooks for you
MATLAB: An Introduction with Applications
Statistics
ISBN:
9781119256830
Author:
Amos Gilat
Publisher:
John Wiley & Sons Inc

Probability and Statistics for Engineering and th…
Statistics
ISBN:
9781305251809
Author:
Jay L. Devore
Publisher:
Cengage Learning

Statistics for The Behavioral Sciences (MindTap C…
Statistics
ISBN:
9781305504912
Author:
Frederick J Gravetter, Larry B. Wallnau
Publisher:
Cengage Learning
MATLAB: An Introduction with Applications
Statistics
ISBN:
9781119256830
Author:
Amos Gilat
Publisher:
John Wiley & Sons Inc
Probability and Statistics for Engineering and th…
Statistics
ISBN:
9781305251809
Author:
Jay L. Devore
Publisher:
Cengage Learning
Statistics for The Behavioral Sciences (MindTap C…
Statistics
ISBN:
9781305504912
Author:
Frederick J Gravetter, Larry B. Wallnau
Publisher:
Cengage Learning

Elementary Statistics: Picturing the World (7th E…
Statistics
ISBN:
9780134683416
Author:
Ron Larson, Betsy Farber
Publisher:
PEARSON

The Basic Practice of Statistics
Statistics
ISBN:
9781319042578
Author:
David S. Moore, William I. Notz, Michael A. Fligner
Publisher:
W. H. Freeman

Introduction to the Practice of Statistics
Statistics
ISBN:
9781319013387
Author:
David S. Moore, George P. McCabe, Bruce A. Craig
Publisher:
W. H. Freeman