pls construct hypothesis testing and pls an

MATLAB: An Introduction with Applications
6th Edition
ISBN:9781119256830
Author:Amos Gilat
Publisher:Amos Gilat
Chapter1: Starting With Matlab
Section: Chapter Questions
Problem 1P

Related questions
Question
pls construct hypothesis testing and pls answer the type of test below. thank u
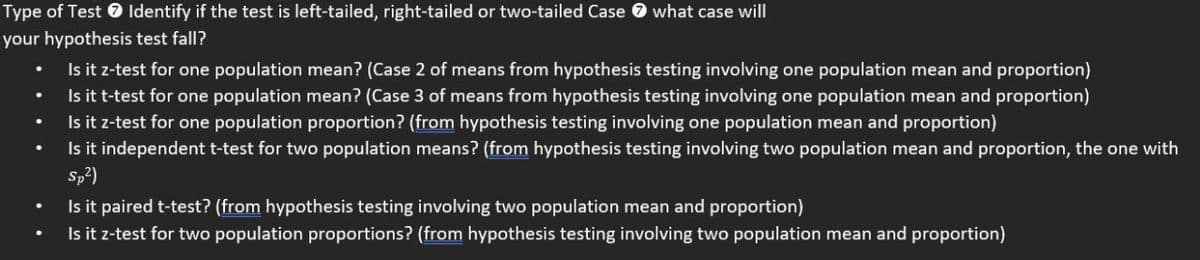
Transcribed Image Text:Type of Test 0 Identify if the test is left-tailed, right-tailed or two-tailed Case O what case will
your hypothesis test fall?
Is it z-test for one population mean? (Case 2 of means from hypothesis testing involving one population mean and proportion)
Is it t-test for one population mean? (Case 3 of means from hypothesis testing involving one population mean and proportion)
Is it z-test for one population proportion? (from hypothesis testing involving one population mean and proportion)
Is it independent t-test for two population means? (from hypothesis testing involving two population mean and proportion, the one with
Sp?)
Is it paired t-test? (from hypothesis testing involving two population mean and proportion)
Is it z-test for two population proportions? (from hypothesis testing involving two population mean and proportion)
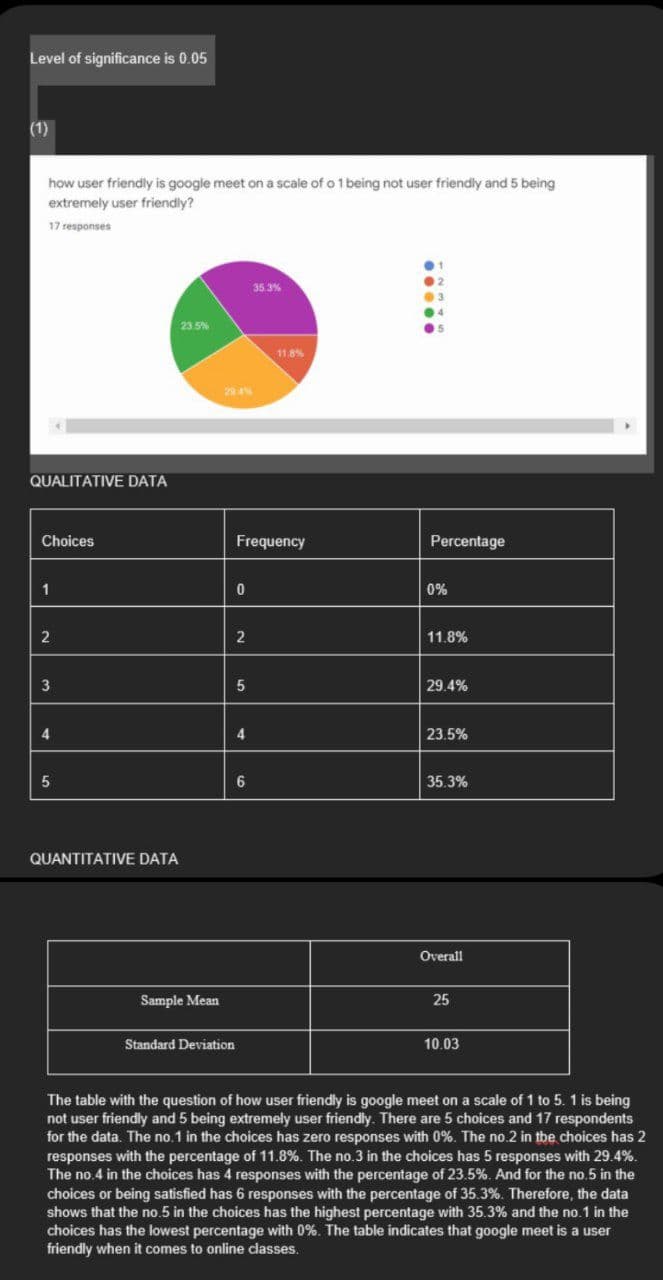
Transcribed Image Text:Level of significance is 0.05
(1)
how user friendly is google meet on a scale of o 1 being not user friendly and 5 being
extremely user friendly?
17 responses
35.3%
23 5%
11.8%
29.4%
QUALITATIVE DATA
Choices
Frequency
Percentage
1
0%
2
2
11.8%
3
5
29.4%
4
23.5%
35.3%
QUANTITATIVE DATA
Overall
Sample Mean
25
Standard Deviation
10.03
The table with the question of how user friendly is google meet on a scale of 1 to 5. 1 is being
not user friendly and 5 being extremely user friendly. There are 5 choices and 17 respondents
for the data. The no.1 in the choices has zero responses with 0%. The no.2 in tbe choices has 2
responses with the percentage of 11.8%. The no.3 in the choices has 5 responses with 29.4%.
The no.4 in the choices has 4 responses with the percentage of 23.5%. And for the no.5 in the
choices or being satisfied has 6 responses with the percentage of 35.3%. Therefore, the data
shows that the no.5 in the choices has the highest percentage with 35.3% and the no.1 in the
choices has the lowest percentage with 0%. The table indicates that google meet is a user
friendly when it comes to online classes.
Expert Solution
This question has been solved!
Explore an expertly crafted, step-by-step solution for a thorough understanding of key concepts.

Step by step
Solved in 3 steps with 4 images

Recommended textbooks for you
MATLAB: An Introduction with Applications
Statistics
ISBN:
9781119256830
Author:
Amos Gilat
Publisher:
John Wiley & Sons Inc

Probability and Statistics for Engineering and th…
Statistics
ISBN:
9781305251809
Author:
Jay L. Devore
Publisher:
Cengage Learning

Statistics for The Behavioral Sciences (MindTap C…
Statistics
ISBN:
9781305504912
Author:
Frederick J Gravetter, Larry B. Wallnau
Publisher:
Cengage Learning
MATLAB: An Introduction with Applications
Statistics
ISBN:
9781119256830
Author:
Amos Gilat
Publisher:
John Wiley & Sons Inc
Probability and Statistics for Engineering and th…
Statistics
ISBN:
9781305251809
Author:
Jay L. Devore
Publisher:
Cengage Learning
Statistics for The Behavioral Sciences (MindTap C…
Statistics
ISBN:
9781305504912
Author:
Frederick J Gravetter, Larry B. Wallnau
Publisher:
Cengage Learning

Elementary Statistics: Picturing the World (7th E…
Statistics
ISBN:
9780134683416
Author:
Ron Larson, Betsy Farber
Publisher:
PEARSON

The Basic Practice of Statistics
Statistics
ISBN:
9781319042578
Author:
David S. Moore, William I. Notz, Michael A. Fligner
Publisher:
W. H. Freeman

Introduction to the Practice of Statistics
Statistics
ISBN:
9781319013387
Author:
David S. Moore, George P. McCabe, Bruce A. Craig
Publisher:
W. H. Freeman