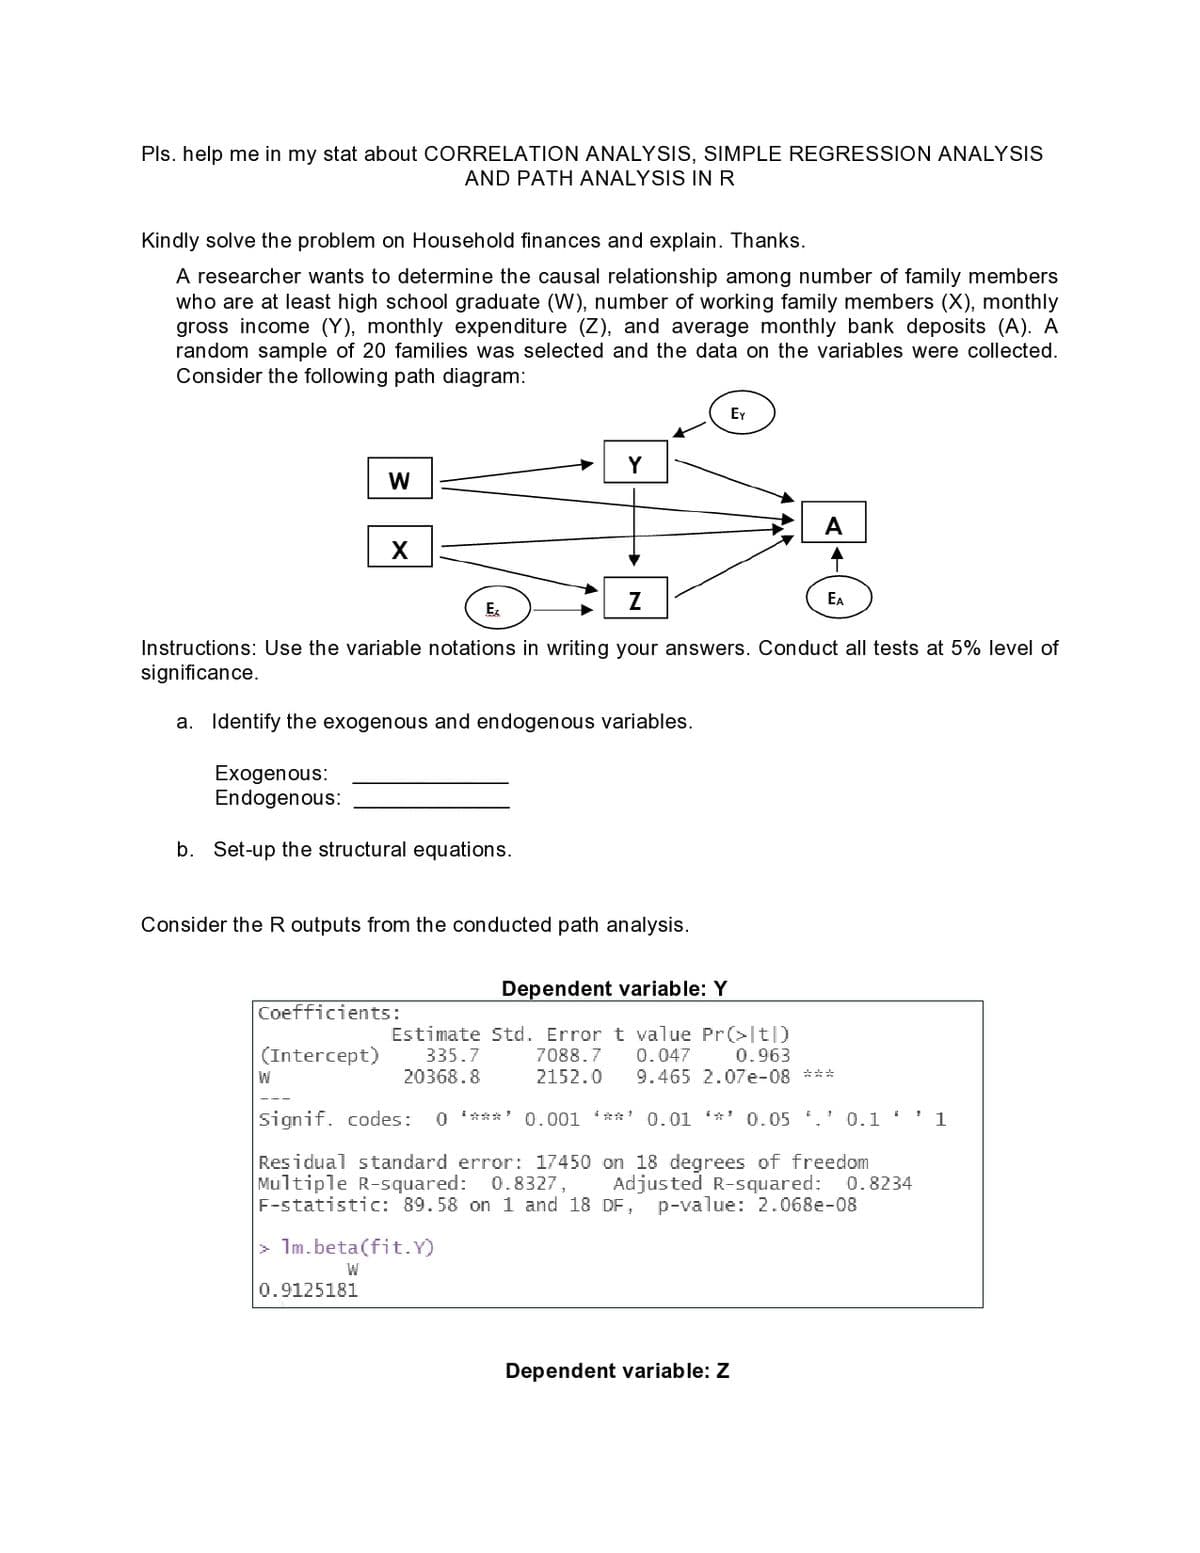
Pls. help me in my stat about CORRELATION ANALYSIS, SIMPLE REGRESSION ANALYSIS AND PATH ANALYSIS IN R Kindly solve the problem on Household finances and explain. Thanks. A researcher wants to determine the causal relationship among number of family members who are at least high school graduate (W), number of working family members (X), monthly gross income (Y), monthly expenditure (Z), and average monthly bank deposits (A). A random sample of 20 families was selected and the data on the variables were collected. Consider the following path diagram: W X Ex Exogenous: Endogenous: b. Set-up the structural equations. Y Z Instructions: Use the variable notations in writing your answers. Conduct all tests at 5% level of significance. a. Identify the exogenous and endogenous variables. Consider the R outputs from the conducted path analysis. Coefficients: (Intercept) Ey A EA Dependent variable: Y Estimate Std. Error t value Pr(>[t]) 335.7 7088.7 0.047 0.963 20368.8 2152.0 9.465 2.07e-08 ***
Pls. help me in my stat about CORRELATION ANALYSIS, SIMPLE REGRESSION ANALYSIS AND PATH ANALYSIS IN R Kindly solve the problem on Household finances and explain. Thanks. A researcher wants to determine the causal relationship among number of family members who are at least high school graduate (W), number of working family members (X), monthly gross income (Y), monthly expenditure (Z), and average monthly bank deposits (A). A random sample of 20 families was selected and the data on the variables were collected. Consider the following path diagram: W X Ex Exogenous: Endogenous: b. Set-up the structural equations. Y Z Instructions: Use the variable notations in writing your answers. Conduct all tests at 5% level of significance. a. Identify the exogenous and endogenous variables. Consider the R outputs from the conducted path analysis. Coefficients: (Intercept) Ey A EA Dependent variable: Y Estimate Std. Error t value Pr(>[t]) 335.7 7088.7 0.047 0.963 20368.8 2152.0 9.465 2.07e-08 ***

Glencoe Algebra 1, Student Edition, 9780079039897, 0079039898, 2018
18th Edition
ISBN:9780079039897
Author:Carter
Publisher:Carter
Chapter4: Equations Of Linear Functions
Section4.5: Correlation And Causation
Problem 15PPS

Related questions
Question
100%
Pls. help me in my stat about
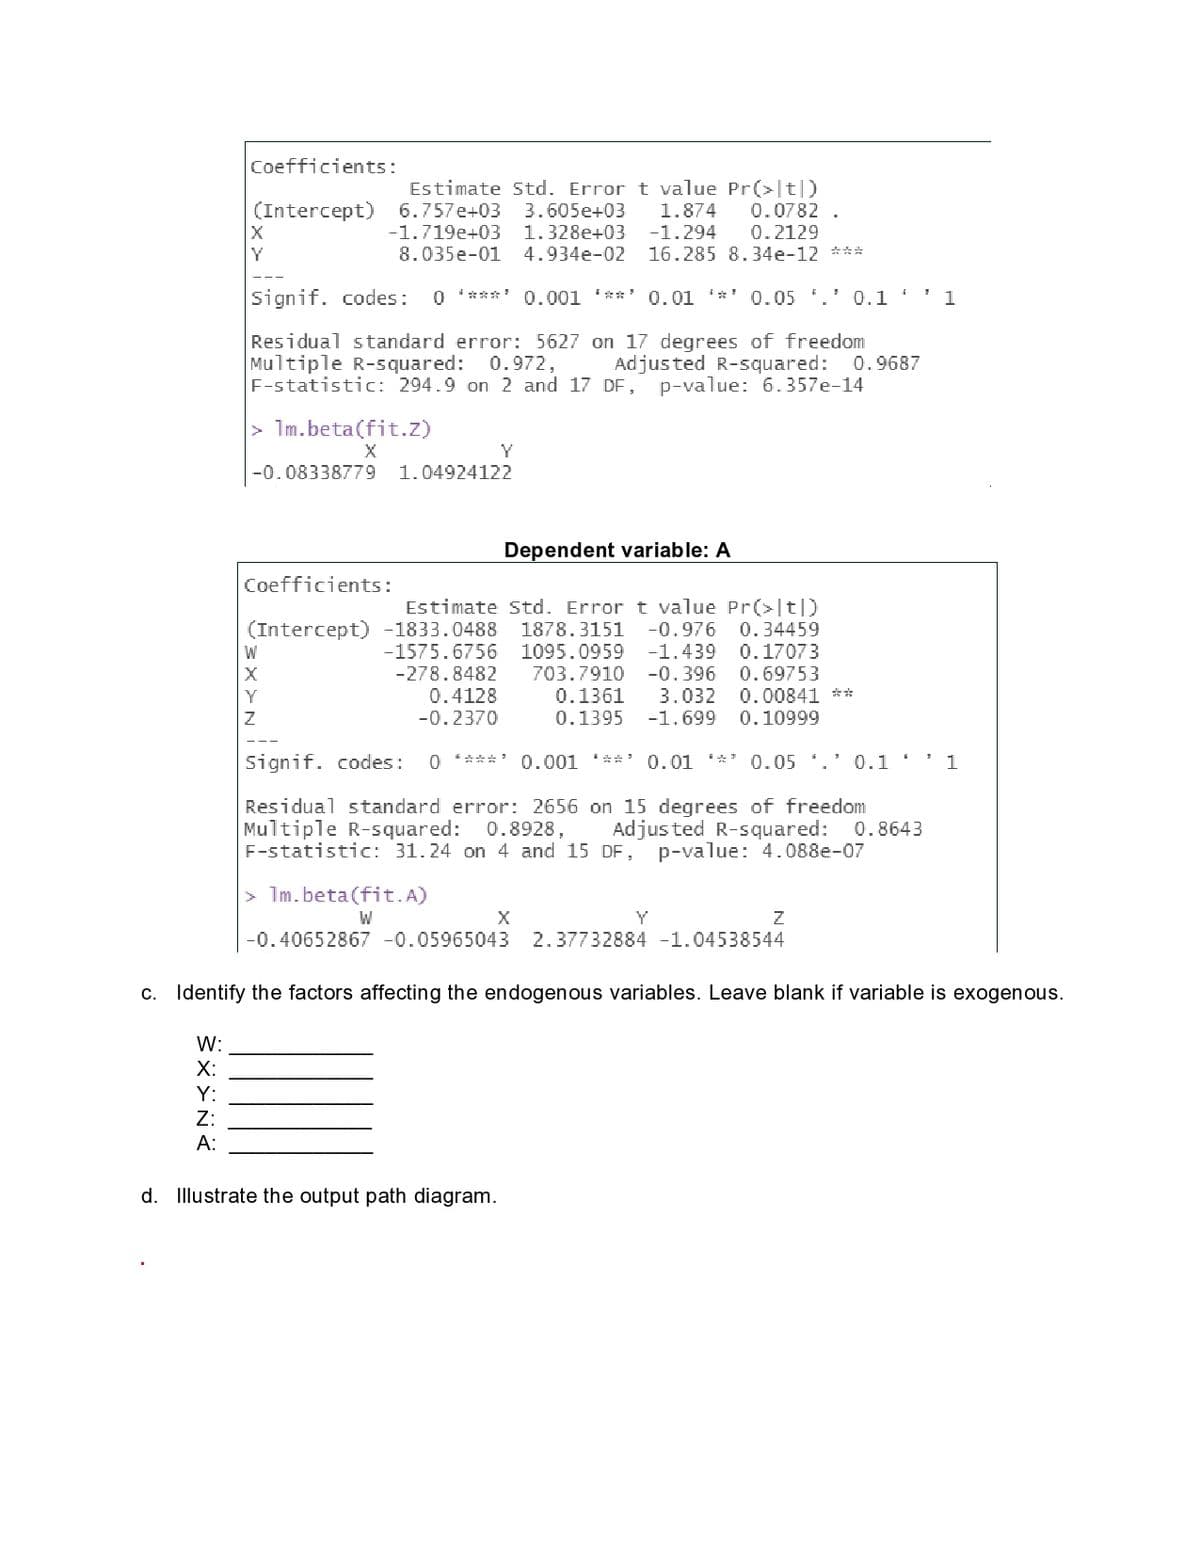
Transcribed Image Text:Coefficients:
(Intercept)
W:
X:
Y:
Z:
A:
X
Y
Estimate Std. Error t value Pr(>|t|)
6.757e+03 3.605e+03
0.0782.
1.874
1.328e+03 -1.294
-1.719e+03
0.2129
8.035e-01
4.934e-02 16.285 8.34e-12 ***
Signif. codes: 0 ***** 0.001 '**' 0.01 '*' 0.05 .' 0.1 '
Residual standard error: 5627 on 17 degrees of freedom
Multiple R-squared: 0.972, Adjusted R-squared: 0.9687
F-statistic: 294.9 on 2 and 17 DF, p-value: 6.357e-14
> 1m.beta(fit.z)
X
-0.08338779 1.04924122
W
X
Y
Z
Y
Coefficients:
Estimate Std. Error t value Pr(>|t|)
(Intercept) -1833.0488 1878.3151 -0.976 0.34459
-1575.6756 1095.0959 -1.439
0.17073
703.7910 -0.396 0.69753
-278.8482
0.4128
0.1361 3.032 0.00841 **
0.1395 -1.699 0.10999
-0.2370
1m.beta(fit.A)
W
Dependent variable: A
Signif. codes: ***** 0.001 ***' 0.01 0.05 *.' 0.1'' 1
Residual standard error: 2656 on 15 degrees of freedom
Multiple R-squared: 0.8928, Adjusted R-squared:
F-statistic: 31.24 on 4 and 15 DF, p-value: 4.088e-07
X
d. Illustrate the output path diagram.
Y
Z
-0.40652867 -0.05965043 2.37732884 -1.04538544
1
0.8643
c. Identify the factors affecting the endogenous variables. Leave blank if variable is exogenous.
Transcribed Image Text:Pls. help me in my stat about CORRELATION ANALYSIS, SIMPLE REGRESSION ANALYSIS
AND PATH ANALYSIS IN R
Kindly solve the problem on Household finances and explain. Thanks.
A researcher wants to determine the causal relationship among number of family members
who are at least high school graduate (W), number of working family members (X), monthly
gross income (Y), monthly expenditure (Z), and average monthly bank deposits (A). A
random sample of 20 families was selected and the data on the variables were collected.
Consider the following path diagram:
W
X
Z
Instructions: Use the variable notations in writing your answers. Conduct all tests at 5% level of
significance.
a. Identify the exogenous and endogenous variables.
Exogenous:
Endogenous:
b. Set-up the structural equations.
Consider the R outputs from the conducted path analysis.
W
Coefficients:
(Intercept)
Ez
0.9125181
1m.beta(fit.Y)
W
Dependent variable: Y
Estimate Std. Error t value Pr>ltl)
335.7
7088.7 0.047
0.963
20368.8
2152.0 9.465 2.07e-08 ***
Signif. codes: 0 ****' 0.001 ***' 0.01 0.05 . 0.1 ' ' 1
Residual standard error: 17450 on 18 degrees of freedom
Multiple R-squared: 0.8327, Adjusted R-squared: 0.8234
F-statistic: 89.58 on 1 and 18 DF, p-value: 2.068e-08
Ey
A
Dependent variable: Z
EA
Expert Solution
This question has been solved!
Explore an expertly crafted, step-by-step solution for a thorough understanding of key concepts.

Step by step
Solved in 4 steps with 3 images

Follow-up Questions
Read through expert solutions to related follow-up questions below.
Follow-up Question
Follow-up question on the Household finances:
Pls. Illustrate the output path diagram. Thanks.
Solution
Recommended textbooks for you
Glencoe Algebra 1, Student Edition, 9780079039897…
Algebra
ISBN:
9780079039897
Author:
Carter
Publisher:
McGraw Hill

Big Ideas Math A Bridge To Success Algebra 1: Stu…
Algebra
ISBN:
9781680331141
Author:
HOUGHTON MIFFLIN HARCOURT
Publisher:
Houghton Mifflin Harcourt

Functions and Change: A Modeling Approach to Coll…
Algebra
ISBN:
9781337111348
Author:
Bruce Crauder, Benny Evans, Alan Noell
Publisher:
Cengage Learning
Glencoe Algebra 1, Student Edition, 9780079039897…
Algebra
ISBN:
9780079039897
Author:
Carter
Publisher:
McGraw Hill
Big Ideas Math A Bridge To Success Algebra 1: Stu…
Algebra
ISBN:
9781680331141
Author:
HOUGHTON MIFFLIN HARCOURT
Publisher:
Houghton Mifflin Harcourt
Functions and Change: A Modeling Approach to Coll…
Algebra
ISBN:
9781337111348
Author:
Bruce Crauder, Benny Evans, Alan Noell
Publisher:
Cengage Learning