population fall between 45 and 65 miles per hour? O a. 68% O b. Cannot be determined from the given information. O C. Nearly all. O d. 95%
population fall between 45 and 65 miles per hour? O a. 68% O b. Cannot be determined from the given information. O C. Nearly all. O d. 95%

Glencoe Algebra 1, Student Edition, 9780079039897, 0079039898, 2018
18th Edition
ISBN:9780079039897
Author:Carter
Publisher:Carter
Chapter10: Statistics
Section10.4: Distributions Of Data
Problem 19PFA

Related questions
Question
5
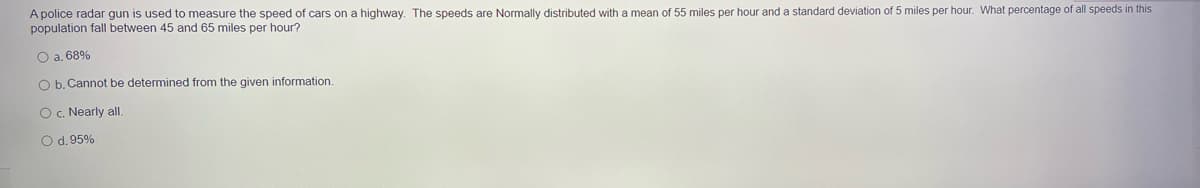
Transcribed Image Text:A police radar gun is used to measure the speed of cars on a highway. The speeds are Normally distributed with a mean of 55 miles per hour and a standard deviation of 5 miles per hour. What percentage of all speeds in this
population fall between 45 and 65 miles per hour?
O a. 68%
O b. Cannot be determined from the given information.
O c. Nearly all.
O d. 95%
Expert Solution
This question has been solved!
Explore an expertly crafted, step-by-step solution for a thorough understanding of key concepts.

Step by step
Solved in 2 steps with 1 images

Recommended textbooks for you
Glencoe Algebra 1, Student Edition, 9780079039897…
Algebra
ISBN:
9780079039897
Author:
Carter
Publisher:
McGraw Hill
Glencoe Algebra 1, Student Edition, 9780079039897…
Algebra
ISBN:
9780079039897
Author:
Carter
Publisher:
McGraw Hill