Pre-Lab Question 1. Make a list of the IR bands and predict the absorption frequencies for the following compounds. a) 2-Chloropropionic acid b) Methyl salicylate
Pre-Lab Question 1. Make a list of the IR bands and predict the absorption frequencies for the following compounds. a) 2-Chloropropionic acid b) Methyl salicylate

Organic Chemistry: A Guided Inquiry
2nd Edition
ISBN:9780618974122
Author:Andrei Straumanis
Publisher:Andrei Straumanis
ChapterL3: Carbon (13c) Nmr Spectroscopy
Section: Chapter Questions
Problem 13CTQ

Related questions
Question
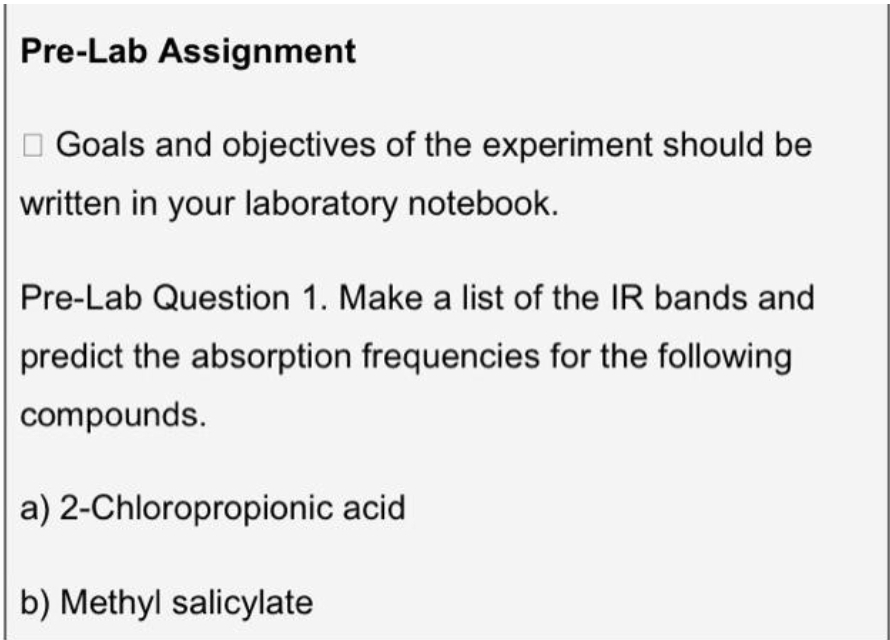
Transcribed Image Text:Pre-Lab Assignment
Goals and objectives of the experiment should be
written in your laboratory notebook.
Pre-Lab Question 1. Make a list of the IR bands and
predict the absorption frequencies for the following
compounds.
a) 2-Chloropropionic acid
b) Methyl salicylate
Expert Solution
This question has been solved!
Explore an expertly crafted, step-by-step solution for a thorough understanding of key concepts.

This is a popular solution!

Trending now
This is a popular solution!

Step by step
Solved in 2 steps with 1 images

Recommended textbooks for you
Organic Chemistry: A Guided Inquiry
Chemistry
ISBN:
9780618974122
Author:
Andrei Straumanis
Publisher:
Cengage Learning

Principles of Instrumental Analysis
Chemistry
ISBN:
9781305577213
Author:
Douglas A. Skoog, F. James Holler, Stanley R. Crouch
Publisher:
Cengage Learning
Organic Chemistry: A Guided Inquiry
Chemistry
ISBN:
9780618974122
Author:
Andrei Straumanis
Publisher:
Cengage Learning
Principles of Instrumental Analysis
Chemistry
ISBN:
9781305577213
Author:
Douglas A. Skoog, F. James Holler, Stanley R. Crouch
Publisher:
Cengage Learning