Price Quantity Supplied Quantity Demanded $10 100 295 11 150 275 12 190 250 13 220 220 14 245 180 15 265 135 If a technological advance lowers production costs such that the quantity supplied increases by 60 units of this product at each price, the new equilibrium price would be A) $13. B) $12. C) $11. D) $14.
Price Quantity Supplied Quantity Demanded $10 100 295 11 150 275 12 190 250 13 220 220 14 245 180 15 265 135 If a technological advance lowers production costs such that the quantity supplied increases by 60 units of this product at each price, the new equilibrium price would be A) $13. B) $12. C) $11. D) $14.

Principles of Economics (MindTap Course List)
8th Edition
ISBN:9781305585126
Author:N. Gregory Mankiw
Publisher:N. Gregory Mankiw
Chapter7: Consumers, Producers, And The Efficiency Of Markets
Section: Chapter Questions
Problem 6CQQ

Related questions
Question
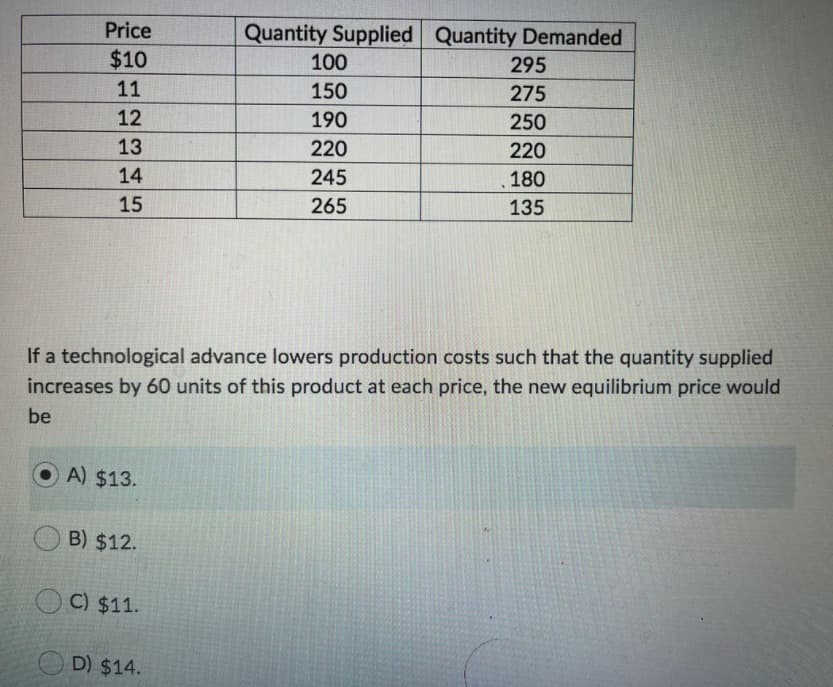
Transcribed Image Text:Price
Quantity Supplied Quantity Demanded
$10
100
295
11
150
275
12
190
250
13
220
220
14
245
.180
15
265
135
If a technological advance lowers production costs such that the quantity supplied
increases by 60 units of this product at each price, the new equilibrium price would
be
O A) $13.
B) $12.
C) $11.
D) $14.
Expert Solution
This question has been solved!
Explore an expertly crafted, step-by-step solution for a thorough understanding of key concepts.

This is a popular solution!

Trending now
This is a popular solution!

Step by step
Solved in 2 steps

Knowledge Booster


Learn more about
Need a deep-dive on the concept behind this application? Look no further. Learn more about this topic, economics and related others by exploring similar questions and additional content below.Recommended textbooks for you
Principles of Economics (MindTap Course List)
Economics
ISBN:
9781305585126
Author:
N. Gregory Mankiw
Publisher:
Cengage Learning

Essentials of Economics (MindTap Course List)
Economics
ISBN:
9781337091992
Author:
N. Gregory Mankiw
Publisher:
Cengage Learning

Principles of Microeconomics (MindTap Course List)
Economics
ISBN:
9781305971493
Author:
N. Gregory Mankiw
Publisher:
Cengage Learning
Principles of Economics (MindTap Course List)
Economics
ISBN:
9781305585126
Author:
N. Gregory Mankiw
Publisher:
Cengage Learning
Essentials of Economics (MindTap Course List)
Economics
ISBN:
9781337091992
Author:
N. Gregory Mankiw
Publisher:
Cengage Learning
Principles of Microeconomics (MindTap Course List)
Economics
ISBN:
9781305971493
Author:
N. Gregory Mankiw
Publisher:
Cengage Learning

Principles of Economics, 7th Edition (MindTap Cou…
Economics
ISBN:
9781285165875
Author:
N. Gregory Mankiw
Publisher:
Cengage Learning