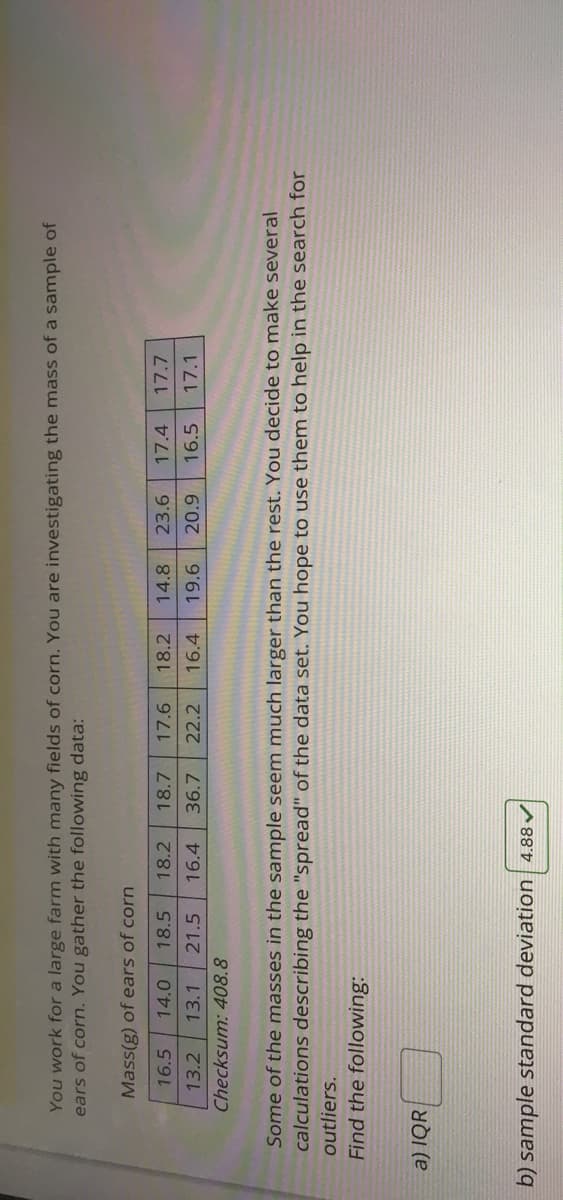
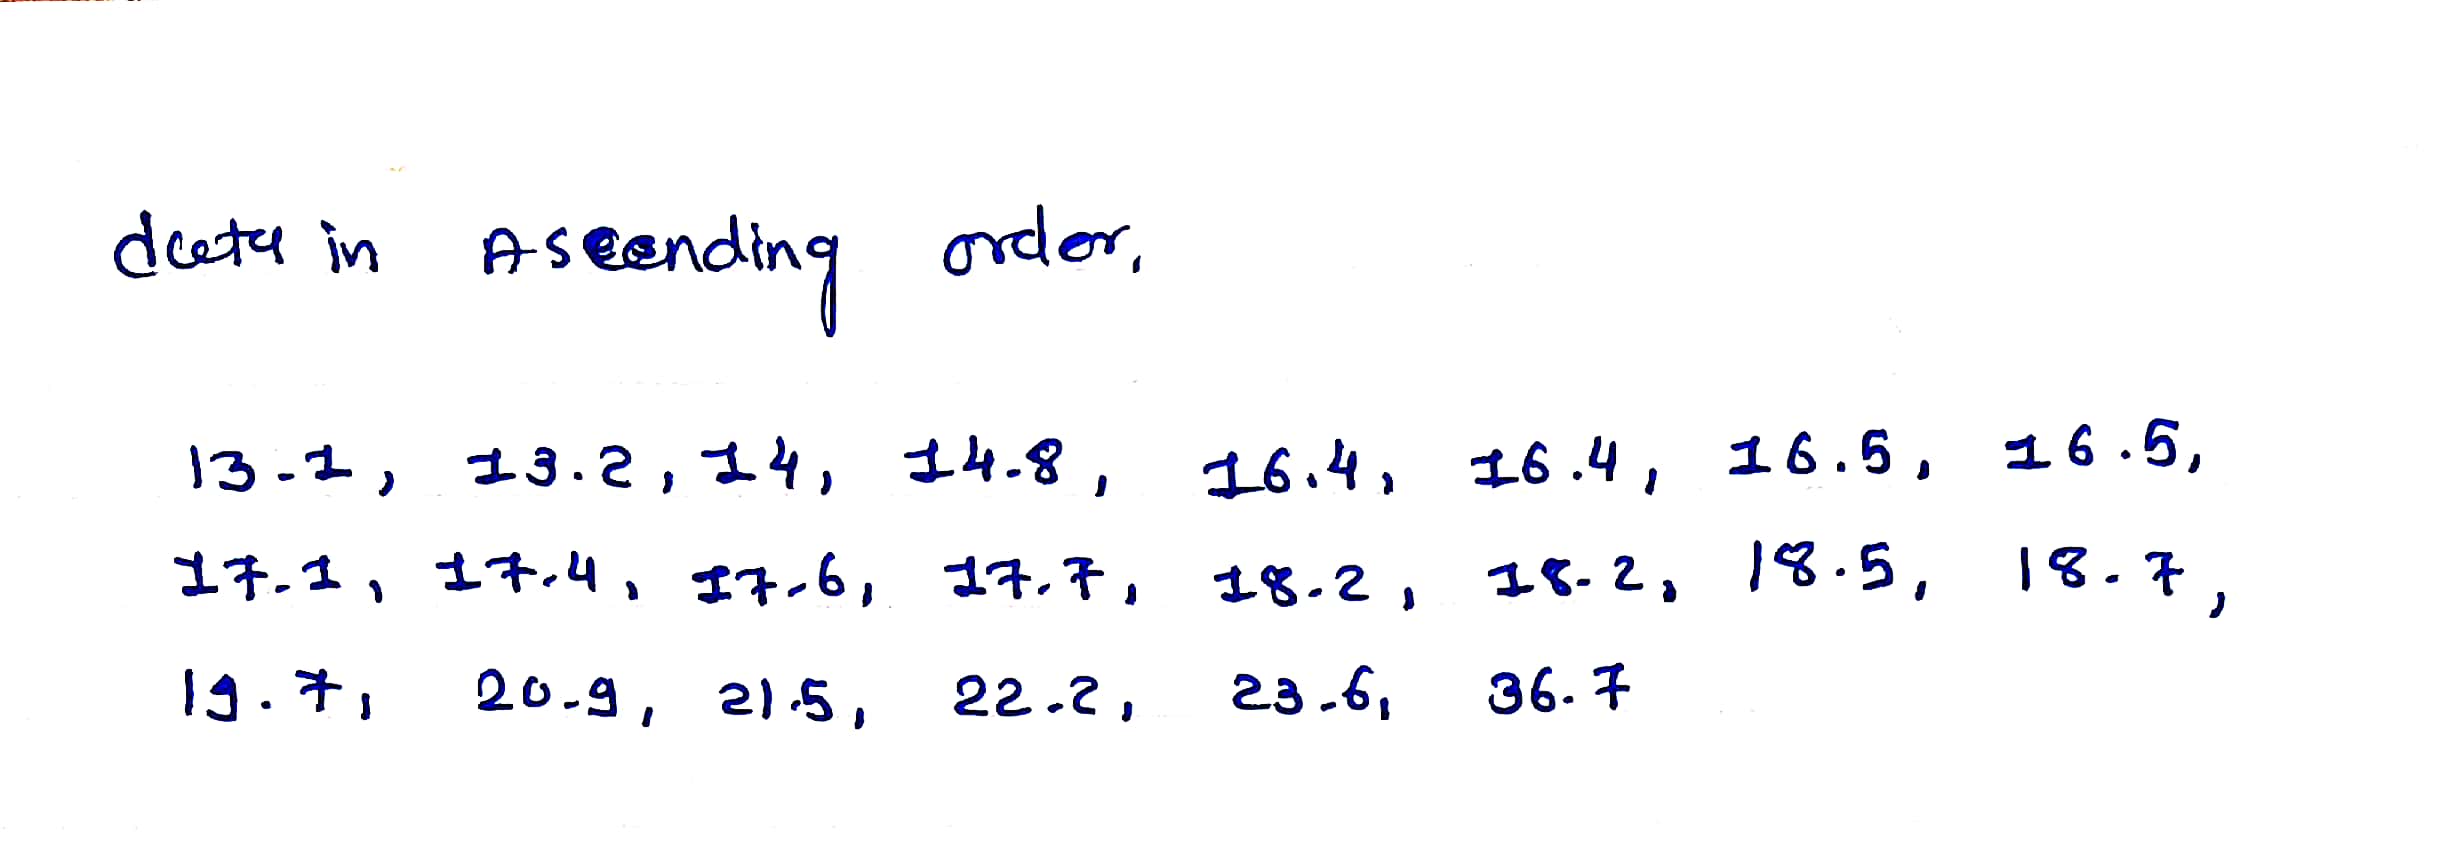
prn. You are investigating the mass öf a sample of 18.2 14.8 23.6 17.4 17.7 16.4 19.6 20.9 16.5 17.1 arger than the rest. You decide to make several set. You hope to use them to help in the search for


Q: Use the data in the table below to complete the exercise. Round off your answers to a tenth of a…
A:
Q: The lengths and weights of a zoo's pygmy shrews were recorded during their annual health check.…
A:
Q: The table below shows the weight in pounds of large adult males in the cat family. Cat Cheetah…
A:
Q: a survey conducted at the beginning of 2010, a hypothetical country with a total land area of…
A: NOTE-AS PER GUIDELINES I HAVE CALCULATED FIRST 3 SUBPARTS ONLY
Q: A sample has SS= 20 and s? = 4. How many scores are in the sample?
A: Six scores are in the sample.
Q: in the previous example, the adult weighing 285 pounds decides to not paricipate in the study. what…
A:
Q: (b) What is the proportion of wolves that are female but do not hunt in medium-sized packs o are not…
A: Hi, the question have the multiple sub-parts and as per the guidelines I am obliged to answer first…
Q: Calculate the number of combinations for how many 3-volume samples can be selected from a 7-volume…
A: Given information- We have given a 7-volume population and we have to select 3-volume samples. We…
Q: The weights, in ounces, of ten packages of potato chips are given below. 16.1 16 15.8 16 15.9 16.1…
A: Average= Sum of observations/No.of observations
Q: Calculate P, for the following data relating to the height of the plants in a garden Heights (in cm)…
A:
Q: A group of laboratory mice were massed and the results are as follows: 504 g, 340 g, 450 g, 499 g,…
A:
Q: Packed in at Rush Hour! Sq. Ft. per standing passenger Morning Morning Afternoon Afterne 1988 1.5…
A: Hello! As you have posted more than 3 sub parts, we are answering the first 3 sub-parts. In case…
Q: A student wanted to study how many matches came in a box. They recorded the following data. How many…
A:
Q: What percentage of the variation in can be explained by the corresponding variations in and taken…
A: X1 is the dependent variable X2 and X3 are the independent variables.
Q: The lengths and weights of a zoo's pygmy shrews were recorded during their annual health check.…
A: The regression equation is given by y = a + bX
Q: An inexperienced statistical clerk submitted the following statistics to his manager on the average…
A: We know working time is inversely proportional to number of workers. Amount of work is…
Q: What percentage of the people who worked were males?
A: men women total work 15 23 80 not work 23 28 51 total 38 93 131 What percentage of the…
Q: A. What was the population in 1850?
A:
Q: Paola has a two-plates scale and two samples, one of 20 gr and the other of 30 gr. Paola must…
A: A two-pan scale has two pans one with the reference weight and the other with the unknown sample.…
Q: A man who state that he manufactured lid for the glass jars was asked what size lids he…
A: It is mentioned that a man manufactured lid for the glass jars. His response for the size lids was…
Q: You go out and collect the following estimates of earthworms / acre: 54,276 57,378 51,108…
A: a. 90% CI is given by- y±z*sn z value is found from z tables which is 1.645. sample size (n) is 7.…
Q: A sample of size 26 was gathered from high school seniors to estimate how many intended to attend…
A: Given that Sample size (n) = 26 The proportion answering Yes (P) = 0.9 P = 0.9 ; Q=1-P = 1-0.9 =0.1…
Q: A group of laboratory mice were massed and the results are as follows: 504 g, 340 g, 450 g, 499 g,…
A: Given query is to find the change in average.
Q: What proportion of students either own an automobile or lives in a dor
A: From the given information, P(own an automobile)=0.60 P(lives in a dormitory)=0.20 P(own an…
Q: We are willing to regard the wood pieces prepared for the lab session as an SRS of all similar…
A: X (X-xbar)^2 33,190 5,517,801 32,320 2,187,441 23,040 60,855,601 24,050 46,117,681 31,860…
Q: Fill in the anova table Source SS df MS F effect 500 2 ? ? error…
A: Let K be the number of elements in effect N be the total number Farmula used F=MSeffect/MSerror
Q: 7. What proportion of time was spent eating and drinking?
A: Given Data is : Sleeping = 8.6 At school = 6.3 Socializing, Relaxing = 3.6 Other = 1.6 Travelling /…
Q: The lengths and weights of a zoo's pygmy shrews were recorded during their annual Length (mm) 95 81…
A: The given data is x y 95 5.4 83 4.5 91 5 82 1.1 75 3.7 62 2.6 79 4.5 63 3.1 81…
Q: The lengths and weights of a zoo's pygmy shrews were recorded during their annual health chec Length…
A: Obtain the value of the spearman’s rank correlation coefficient. The value of the spearman’s rank…
Q: a skeptical paranormal researcher claims that the proportion of Americans that have seen a UFO, p,…
A: It is given that the skeptical paranormal researcher claims that the proportion of Americans that…
Q: 188+ 178- 168+ 158+ 158 168 178 188 Father's height (cm) Son's height (cm)
A: Data visualization is the process of denoting the numerical data visually. Data visualization can be…
Q: The lengths and weights of a zoo's pygmy shrews were recorded during their annual health check.…
A:
Q: The following data describe the weight of 11 Girls and 10 boys : The research question is : for…
A: There are two samples of data. The two samples are named as Girls and Boys. The two samples are…
Q: 1. A report in a national magazine estimated that 39 percent of. . of their wives' eyes. Bill…
A: Let X be the number of American husbands who do not know the color of their wives' eyes. A sample of…
Q: At Becta's Computer Manufacturing, the production team sampled four pieces of precision-cut wire (to…
A:
Q: STATE: How heavy a load (in pounds) is needed to pull apart pieces of Douglas fir 44 inches long and…
A: The sample mean is, Thus, the sample mean is 118.7 pounds.
Q: 6. A sample of 5 fathers and their eldest sons gave the following data about their weight in Kgs.…
A:
Q: Below is a table showing the weights of packages arriving at a post office during a day. Weight (kg)…
A: The following data is given in the question Weight Frequency 5 130 15 200 25 250 35 200…
Q: what percentage of the women did not work?
A: men women total work 15 23 80 not work 23 28 51 total 38 93 131 percentage of the women…
Q: What is the median for the following Pounds of Honey Collected Per Hive 50 51 52 70 71 2 3 14 i5 16…
A: Given,
Q: a) What proportion of the sampled wafers had (P 2 8)? b) What proportion of the sampled wafers had…
A: 5. a) The frequency is, Number of Particles Cumulative frequency Frequency Number of Particles…
Q: mr. One researcher wants to estimate the proportion of MU students who are vegetarian, 6 answered…
A: Sample size is 30. There are 6 students are vegetarians. The hypotheses are given below: Null…
Q: The city council is considering a law that would ban smoking in all public parks. A sample has been…
A: a) From the given information, the number of rows is 2 and the number of columns is 2. The…
Q: Sleep Aids. The additional sleep, to the nearest tenth of an hour, obtained by a sample of 100…
A: Quantitative variable: A variable that provides numerical values of individual and Arithmetic…
Q: For a sample of 12 offenders convicted of weapons violations, the length of prison sentence in…
A: Given Information Length of prison sentence: 6 6 2 12 36 48 60 24 24 20 18 15
Q: 2. A technician collected the following data after measuring the heights of a sample of plants that…
A: Use the given data to calculate the required quantities.
Q: In Ghana, all patients surviving a stroke are supposed to have their cholesterol levels measured…
A: (i) The hypotheses are; Null hypothesis: There is no association between an individual sex and the…
Q: We are willing to regard the wood pieces prepared for the lab session as an SRS of all similar…
A: Provided data is: 33,190 31,860 32,590 26,520 33,280 32,320 33,020 32,030…
Q: You would like to be 99.9 confident that your estimate is within 2% of the true population…
A:
Q: 2. Consider the foot length and foot width of six female grade 4 students in Morning Star Montessori…
A:

Trending now
This is a popular solution!

Step by step
Solved in 2 steps with 2 images

- Periodically, the county Water Department tests the drinking water of homeowners for contaminants such as lead and copper. The lead and copper levels in water specimens collected in 1998 for a sample of 10 residents of a subdevelopement of the county are shown below. lead (μμg/L) copper (mg/L) 4.44.4 0.6430.643 2.42.4 0.570.57 1.51.5 0.460.46 2.62.6 0.8950.895 5.95.9 0.20.2 3.43.4 0.540.54 3.83.8 0.2450.245 1.61.6 0.5830.583 5.75.7 0.7690.769 1.71.7 0.2150.215 (a) Construct a 9999% confidence interval for the mean lead level in water specimans of the subdevelopment. ≤μ≤≤μ≤ (b) Construct a 9999% confidence interval for the mean copper level in water specimans of the subdevelopment. ≤μ≤≤μ≤Periodically, the county Water Department tests the drinking water of homeowners for contminants such as lead and copper. The lead and copper levels in water specimens collected in 1998 for a sample of 10 residents of a subdevelopement of the county are shown below. lead (μμg/L) copper (mg/L) 4.44.4 0.4840.484 2.72.7 0.0760.076 5.35.3 0.5950.595 3.33.3 0.1280.128 5.55.5 0.4690.469 1.71.7 0.4060.406 0.40.4 0.8480.848 0.70.7 0.0220.022 44 0.860.86 2.82.8 0.4250.425 (a) Construct a 99% confidence interval for the mean lead level in water specimans of the subdevelopment. blank≤μ≤blank (b) Construct a 99% confidence interval for the mean copper level in water specimans of the subdevelopment. blank≤μ≤blank11 15 23 29 19 22 21 20 15 25 17 The data above represents the amount of grams of carbohydrates in a serving of breakfast cereal in a sample of 12 different servings: What is the first quartile?
- STATE: How heavy a load (in pounds) is needed to pull apart pieces of Douglas fir 44 inches long and 1.5 inches square? Given are data from students doing a laboratory exercise. 33,190 31,860 32,590 26,520 33,280 32,320 33,020 32,030 30,460 32,700 23,040 30,930 32,720 33,650 32,340 24,050 30,170 31,300 28,730 31,920 We are willing to regard the wood pieces prepared for the lab session as an SRS of all similar pieces of Douglas fir. Engineers also commonly assume that characteristics of materials vary Normally. Suppose that the strength of pieces of wood like these follows a Normal distribution with standard deviation 3000 pounds. PLAN: We will estimate μ by giving a 95% confidence interval. SOLVE: Find the sample mean x¯ . (Enter your answer rounded to the nearest whole number.) x¯= Give a 95% confidence interval, [low, high] , for the mean load required to pull the wood apart. (Enter your answers rounded to the nearest whole number.) low=…In a study conducted to examine the quality of fish after 7 days in ice storage, ten raw fish of the same kind and approximately the same size were caught and prepared for ice storage. The fish were placed in ice storage at different times after being caught. A measure of fish quality was given to each fish after 7 days in ice storage. The sample data are shown below, where "Time" is the number of hours after being caught that the fish was placed in ice storage and "Fish Quality" is the measure given to each fish after 7 days in ice storage (higher numbers mean better quality). Which variable would be considered the response variable? Fish Time: 0 0 2 3 5 6 7 9 11 12 Fish Quality 8.5 8.4 8.0 8.1 7.8 7.6 7.3 7.0 6.8 6.7 Choose the correct answer below. A.Fish Quality B.Time C.Neither variable could be considered a response variable.In an ongoing nationwide survey, a question asked is whether a respondent favors or opposes capital punishment (the death penalty) for persons convicted of murder. The output for this exercise compares the proportions who said that they were opposed to the death penalty in the year 2008 and the year 1993. Sample X N Sample p 2008 637 1912 0.333 1993 333 1418 0.235 Estimate for p(1) − p(2): 0.098 95% CI for p(1) − p(2): (0.068, 0.129) (a) What proportion of the year 2008 sample was opposed to the death penalty? (Round your answer to three decimal places.) What proportion of the year 1993 sample was opposed? (Round your answer to three decimal places.) (b) What is the estimated difference between the proportions opposed to the death penalty in the 2 years? (Use p2008 − p1993. Round your answer to three decimal places.) (c) Write the 95% confidence interval as it is given in the output. to Interpret this interval in the context of this situation. There is a…
- STATE: How heavy a load (in pounds) is needed to pull apart pieces of Douglas fir 4 inches long and 1.5 inches square? Given are data from students doing a laboratory exercise. 33,190 31,860 32,590 26,520 33,280 32,320 33,020 32,030 30,460 32,700 23,040 30,930 32,720 33,650 32,340 24,050 30,170 31,300 28,730 31,920 We are willing to regard the wood pieces prepared for the lab session as an SRS of all similar pieces of Douglas fir. Engineers also commonly assume that characteristics of materials vary Normally. Suppose that the strength of pieces of wood like these follows a Normal distribution with standard deviation 3000 pounds. PLAN: We will estimate ? by giving a 98% confidence interval. SOLVE: Find the sample mean ?¯ . (Enter your answer rounded to the nearest whole number.) ?¯= Give a 98% confidence interval, [???,ℎ??ℎ] , for the mean load required to pull the wood apart. (Enter your answers rounded to the nearest whole number.) ???=…Periodically, the county Water Department tests the drinking water of homeowners for contaminants such as lead and copper. The lead and copper levels in water specimens collected in 1998 for a sample of 10 residents of a subdevelopement of the county are shown below. lead (μμg/L) copper (mg/L) 4.4 0.643 2.4 0.57 1.5 0.46 2.6 0.895 5.9 0.2 3.4 0.54 3.8 0.245 1.6 0.583 5.7 0.769 1.7 0.215 (a) Construct a 9999% confidence interval for the mean lead level in water specimans of the subdevelopment. ≤μ≤A blood pressure measurement consists of two numbers: the systolic pressure, which is the maximum pressure taken when the heart is contracting, and the diastolic pressure, which is the minimum pressure taken at the beginning of the heartbeat. Blood pressures taken at rest were measured, in millimeters, for a sample of 15 adults. The following table presents the results. Systolic 134 115 113 123 119 118 130 116 133 112 107 110 105 157 154 Diastolic 87 83 77 77 69 88 76 70 91 75 71 74 66 103 94 Below is a scatterplot of the data set. (a) Suppose we want to use systolic blood pressure to predict diastolic blood pressure. The explanatory variable is diaslostic blood pressure and the response variable is systolic blood pressure. (b) Describe the form, direction, and strength of the relationship: Form (Linear or Non-Linear) Linear Direction (Positive or Negative) Positive Strength (Weak or Moderate or Strong) Moderate (c) Find the value of the correlation…
- A blood pressure measurement consists of two numbers: the systolic pressure, which is the maximum pressure taken when the heart is contracting, and the diastolic pressure, which is the minimum pressure taken at the beginning of the heartbeat. Blood pressures taken at rest were measured, in millimeters, for a sample of 15 adults. The following table presents the results. Systolic 134 115 113 123 119 118 130 116 133 112 107 110 105 157 154 Diastolic 87 83 77 77 69 88 76 70 91 75 71 74 66 103 94 (c) Find the value of the correlation coefficient between systolic blood pressure and diastolic blood pressure. (d) What percentage of the variation in diastolic blood pressure can be explained by systolic blood pressure? (e) Find an equation of the least-squares regression line for systolic blood pressure and diastolic blood pressure.A blood pressure measurement consists of two numbers: the systolic pressure, which is the maximum pressure taken when the heart is contracting, and the diastolic pressure, which is the minimum pressure taken at the beginning of the heartbeat. Blood pressures taken at rest were measured, in millimeters, for a sample of 15 adults. The following table presents the results. Systolic 134 115 113 123 119 118 130 116 133 112 107 110 105 157 154 Diastolic 87 83 77 77 69 88 76 70 91 75 71 74 66 103 94 Below is a scatterplot of the data set. (a) Suppose we want to use systolic blood pressure to predict diastolic blood pressure. The explanatory variable is and the response variable is . (b) Describe the form, direction, and strength of the relationship: Form (Linear or Non-Linear) Direction (Positive or Negative) Strength (Weak or Moderate or Strong) (c) Find the value of the correlation coefficient between systolic blood pressure and diastolic blood pressure.…A blood pressure measurement consists of two numbers: the systolic pressure, which is the maximum pressure taken when the heart is contracting, and the diastolic pressure, which is the minimum pressure taken at the beginning of the heartbeat. Blood pressures taken at rest were measured, in millimeters, for a sample of 15 adults. The following table presents the results. Systolic 134 115 113 123 119 118 130 116 133 112 107 110 105 157 154 Diastolic 87 83 77 77 69 88 76 70 91 75 71 74 66 103 94 (f) When I measured my blood pressure this morning, my systolic blood pressure was 121. Use the least-squares line to predict my diastolic blood pressure. (g) When my systolic blood pressure measured 121, my diastolic blood pressure reading was actually 77. Does the model overestimate, underestimate or accurately predict my diastolic blood pressure? (h) For what range of systolic blood pressure readings would it be appropriate to use this regression line equation to…