What percentage of the variation in can be explained by the corresponding variations in and taken together
What percentage of the variation in can be explained by the corresponding variations in and taken together

Glencoe Algebra 1, Student Edition, 9780079039897, 0079039898, 2018
18th Edition
ISBN:9780079039897
Author:Carter
Publisher:Carter
Chapter4: Equations Of Linear Functions
Section4.5: Correlation And Causation
Problem 2AGP

Related questions
Question
What percentage of the variation in can be explained by the corresponding variations in and taken together?
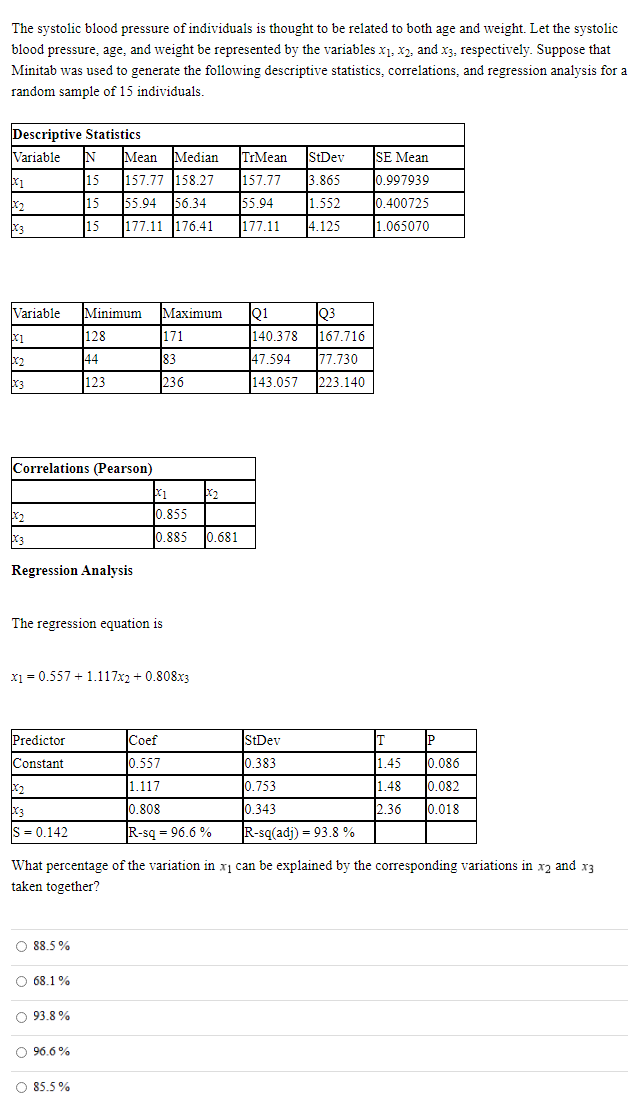
Transcribed Image Text:The systolic blood pressure of individuals is thought to be related to both age and weight. Let the systolic
blood pressure, age, and weight be represented by the variables x1, x2, and x3, respectively. Suppose that
Minitab was used to generate the following descriptive statistics, correlations, and regression analysis for a
random sample of 15 individuals.
Descriptive Statistics
Variable
Mean Median
TrMean
StDev
SE Mean
0.997939
0.400725
15
157.77 158.27
157.77
.865
15
55.94
56.34
55.94
1.552
X3
15
177.11 176.41
177.11
4.125
1.065070
Variable
Minimum
Маximum
Q1
Q3
128
171
140.378
167.716
Ix
83
44
47.594
77.730
223.140
123
236
143.057
Correlations (Pearson)
Ix
0.855
0.885
0.681
Ex
Regression Analysis
The regression equation is
x1 = 0.557 + 1.117x2 + 0.808x3
Coef
Predictor
Constant
StDev
IT
P
0.557
0.383
1.45
0.086
x2
1.117
0.753
1.48
0.082
0.808
0.018
2.36
R-sq(adj) = 93.8 %
0.343
S = 0.142
R-sq = 96.6 %
What percentage of the variation in xị can be explained by the corresponding variations in x2 and x3
taken together?
O 88.5 %
O 68.1 %
O 93.8 %
O 96.6%
O 85.5%
Expert Solution
This question has been solved!
Explore an expertly crafted, step-by-step solution for a thorough understanding of key concepts.

Step by step
Solved in 2 steps

Knowledge Booster


Learn more about
Need a deep-dive on the concept behind this application? Look no further. Learn more about this topic, statistics and related others by exploring similar questions and additional content below.Recommended textbooks for you
Glencoe Algebra 1, Student Edition, 9780079039897…
Algebra
ISBN:
9780079039897
Author:
Carter
Publisher:
McGraw Hill

Big Ideas Math A Bridge To Success Algebra 1: Stu…
Algebra
ISBN:
9781680331141
Author:
HOUGHTON MIFFLIN HARCOURT
Publisher:
Houghton Mifflin Harcourt
Glencoe Algebra 1, Student Edition, 9780079039897…
Algebra
ISBN:
9780079039897
Author:
Carter
Publisher:
McGraw Hill
Big Ideas Math A Bridge To Success Algebra 1: Stu…
Algebra
ISBN:
9781680331141
Author:
HOUGHTON MIFFLIN HARCOURT
Publisher:
Houghton Mifflin Harcourt