The relative frequency of a class in a frequency distribution is 0.2. If the distribution has a total of 50 observations, then the frequency of the class is, a. 25 О Ь. 15 О с. 10 O d. 12
The relative frequency of a class in a frequency distribution is 0.2. If the distribution has a total of 50 observations, then the frequency of the class is, a. 25 О Ь. 15 О с. 10 O d. 12

Glencoe Algebra 1, Student Edition, 9780079039897, 0079039898, 2018
18th Edition
ISBN:9780079039897
Author:Carter
Publisher:Carter
Chapter10: Statistics
Section10.6: Summarizing Categorical Data
Problem 4CGP

Related questions
Question
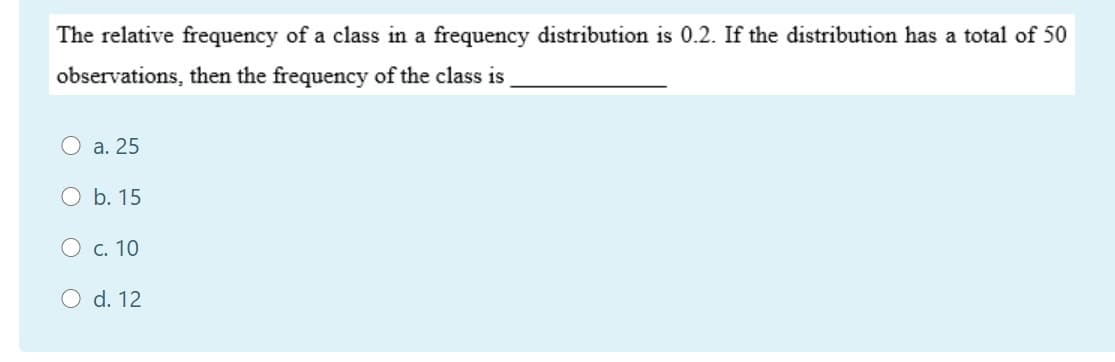
Transcribed Image Text:The relative frequency of a class in a frequency distribution is 0.2. If the distribution has a total of 50
observations, then the frequency of the class is,
a. 25
О Ь. 15
О с. 10
O d. 12
Expert Solution
This question has been solved!
Explore an expertly crafted, step-by-step solution for a thorough understanding of key concepts.

Step by step
Solved in 2 steps

Recommended textbooks for you
Glencoe Algebra 1, Student Edition, 9780079039897…
Algebra
ISBN:
9780079039897
Author:
Carter
Publisher:
McGraw Hill
Glencoe Algebra 1, Student Edition, 9780079039897…
Algebra
ISBN:
9780079039897
Author:
Carter
Publisher:
McGraw Hill